 LOGIN
LOGIN

Advan Auto’s Q2 results were all about whether they can rebuild DIFM market share and drive profitability higher. On the former, market share losses continue as readers will recall from our note on O’Reilly’s results. In an industry* that grew by +2-3% in the period, Advan’s comp-sales increased 0.1%, and comp-transactions were down low-single-digits. DIFM comp-ed up low-single-digits (O’Reilly comp-ed +7% in DIFM). Management shared that the April 19th to May 17th period was similar to the quarter’s ending 4-weeks that July (July 12th), with a soft spot in between. Moreover, the period following the end of the fiscal period, was still stronger. That pattern is reflected in Advan’s observed traffic for Advance. Of note, we have not adjusted the figures to account for the closure of 430 Advance Auto locations and 55 Carquest locations over the past year as we don’t know how to weight the impact, i.e. the impact is less than the 10% reduction in number of locations as many of the closed locations would have had performance that was far below average.
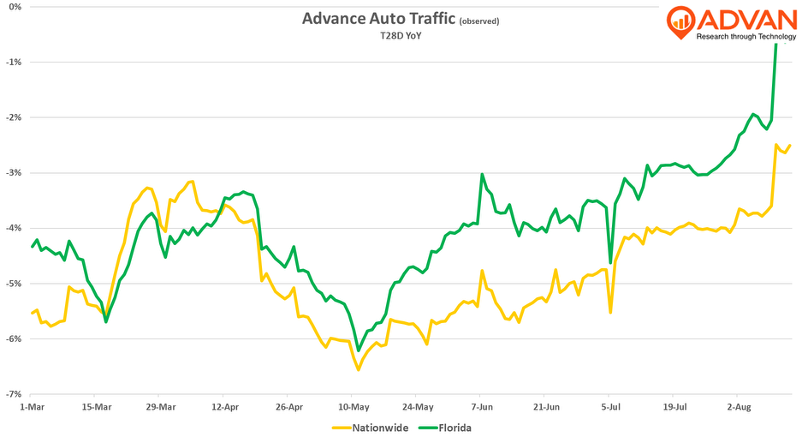
Florida is a “must win” market for Advance given that Florida is Advance’s largest market. Florida actually has more Advance locations than last year (+7 or +1.3%). While it’s disconcerting that Florida is down similarly to the nationwide level for observed visits, the trend since May has strengthened. Moreover, to get at DIFM vs DIY, we filter visitation to 6+ visits, which gives us a signal of the stores’ driver activity. For Orlando (just a representative market), DIFM visits went from -200 bps slower than average in Q1 to +300 bps faster in Q2, providing support to management’s claim that their initiatives to rebuild the DIFM business are showing results, particularly in-stock part availability and delivery speeds.
On better in-stock availability O’Kelly shared, “Over the past year, we have made considerable progress on analyzing customer needs, identifying gaps within our assortment and improving internal processes to introduce new products in the market. This has enabled us to add more than 60,000 new SKUs in our network year-to-date, which is up nearly 300% compared to last year. Providing faster access to parts enables us to respond to demand signals more quickly, driving more effective placement of SKUs across our network. The progress we have achieved in SKU expansion has also contributed to the improvement in our store availability KPI, which increased by approximately 100 basis points compared to Q1 and is currently in the mid-90s range.”
In terms of profitability and in the context of having to offer customers greater value and improved service, the measure was better. Gross margins were slightly higher and the SG&A rate slightly better. While free cash flow through the 1H was an outflow of -$200M, cash generation is expected to improve to +$150M in the 2H and operating margins from 3.0% to 4.0%. Those improvements come despite a substantial level of tariff cost inflation. CEO Shane O’Kelly, “Approximately 40% of our reported cost of goods is exposed to tariffs at a blended rate of approximately 30%. The dynamic tariff environment has certainly presented challenges across the industry. However, we have been able to navigate through this complex landscape, thanks to our much-improved price management capabilities. Our pricing team has been successful in identifying dutiable components across product lines, which is enabling more effective discussions with vendors around cost increases.” The end-result / flow-through to the consumer is to be in the +3-4% range. *Our measure of the market is the Census Bureau’s MRTS report and NAICS #4413.