Advan Research
Login icon LOGIN

Yiannis Tsiounis

Back-to-work: A Look Across the Country

Back-to-work: A Look Across the Country

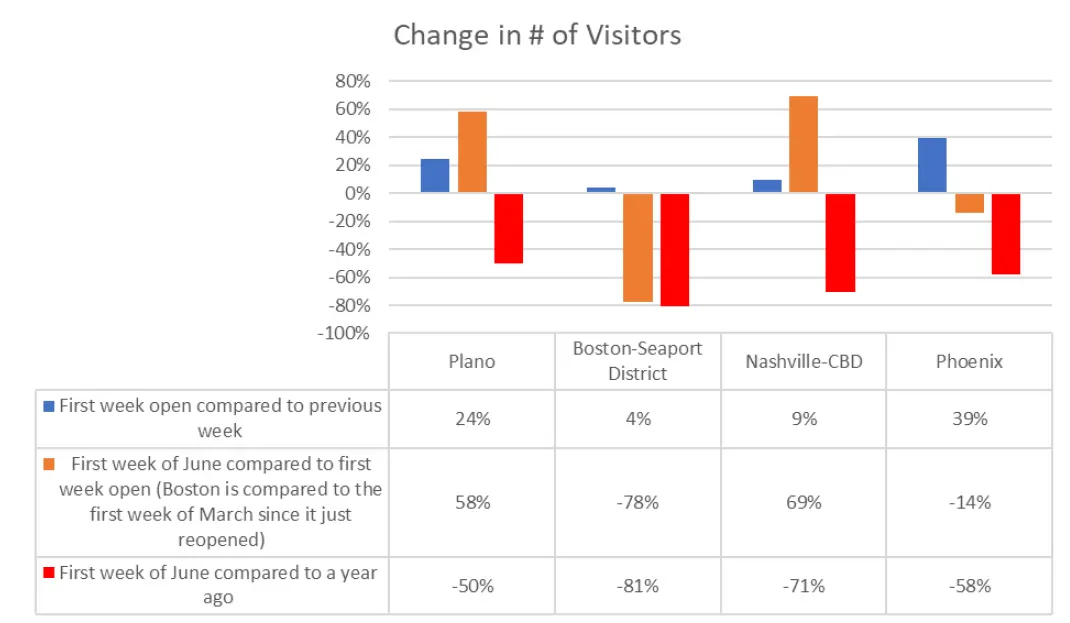
Building on previous posts from Advan Research and Eigen10 Advisors using anonymized cell phone movement over time to analyze the impact of Covid-19 on various real estate property segments, this week we explore the different experiences metro areas have had returning to the office. The market areas were chosen to represent a cross-section of the country, which had their own set of stay in place orders, and in turn, timing of a return to work.
3 minutes
Effect of Covid19 on Student Housing

Effect of Covid19 on Student Housing

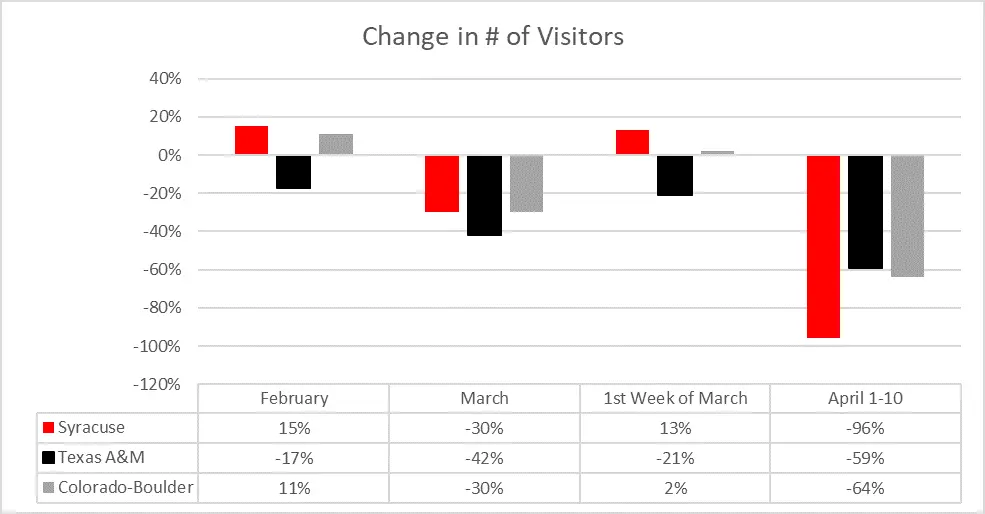
This week in our Covid-19 report using foot traffic data from Advan we examine the impact of the virus on student housing. We looked at three student housing buildings, located in College Station (Texas A&M), Boulder (University of Colorado) and Syracuse. All three universities sent students home and switched to online learning in mid-March. Knowing how quickly tenants reacted to the shutdown and when they come back allows owners, operators and leasing agents to make focused decisions that could potentially enhance value and lead to outperformance.
3 minutes
Foot Traffic indices Show State-by-State Differences in Social Distancing

Foot Traffic indices Show State-by-State Differences in Social Distancing

Over the past weeks we have been working on new ways to analyze foot traffic, in order to help our clients understand how patterns of movement are changing, and what this means for businesses. As part of our COVID-19 package we have developed over 200 indices for multiple sectors and industries including restaurants, grocery stores, electronics, cloth-ing/accessories. These sectors can be segmented by US state as a way to visualize the response to COVID19 by using foot traffic as a proxy for social distancing.
2 minutes
Amazon warehouse traffic illustrates importance of retailer

Amazon warehouse traffic illustrates importance of retailer

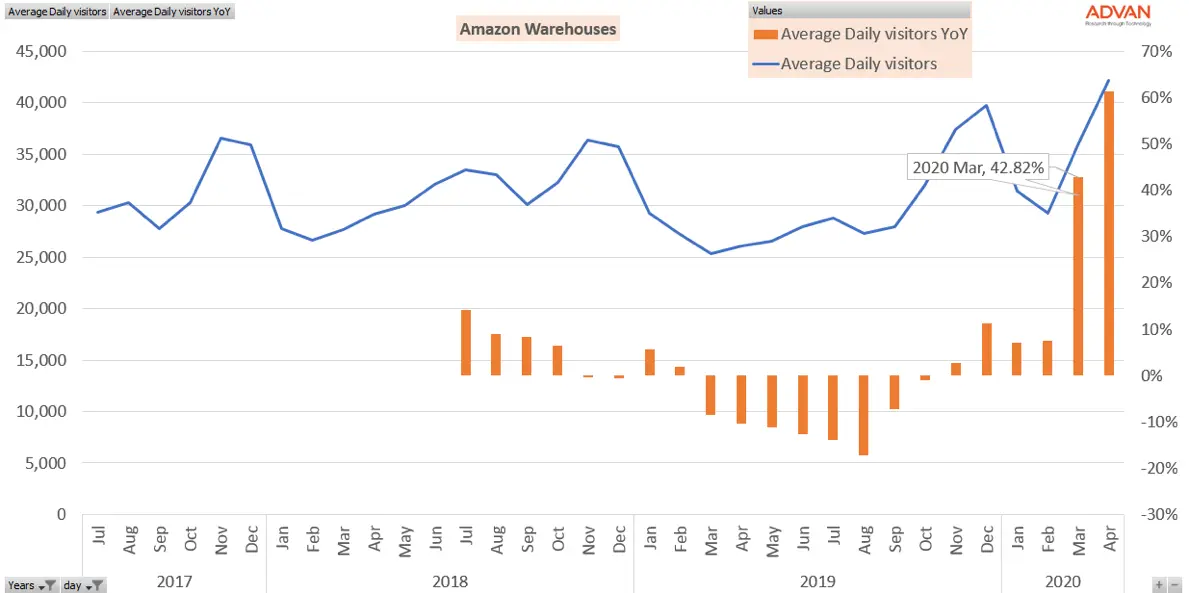
Average daily traffic to Amazon warehouses spiked dramatically in March as the retailer ramped up its staff. Average daily traffic in March was up 43% compared to year earlier, far outstripping seasonal staffing increases. In the first few days of April the number of Amazon employees seen at their warehouses has continued to grow, as demand for home delivery surges, with increasing numbers of people following strict orders from local authorities to stay home.
One minute
Tracking Real-Time Economic Changes to an Office Property

Tracking Real-Time Economic Changes to an Office Property

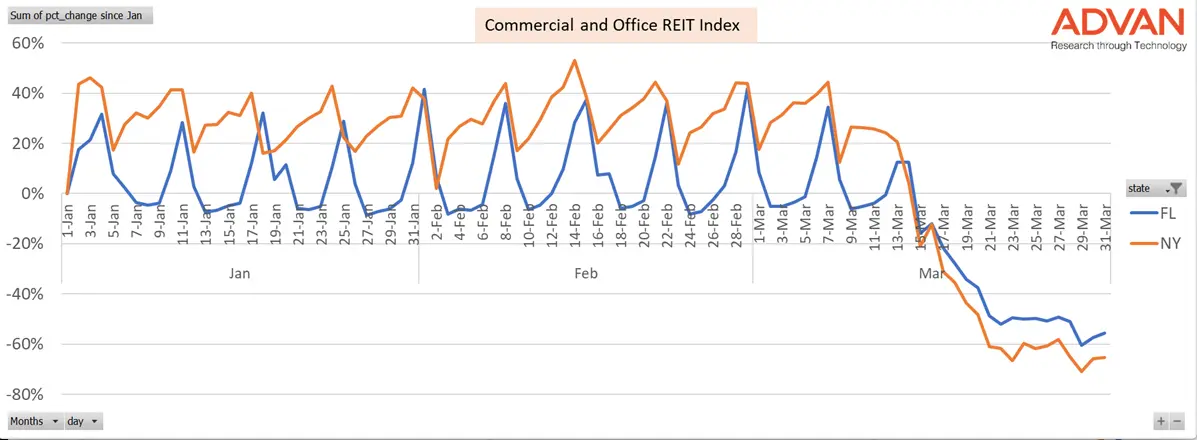
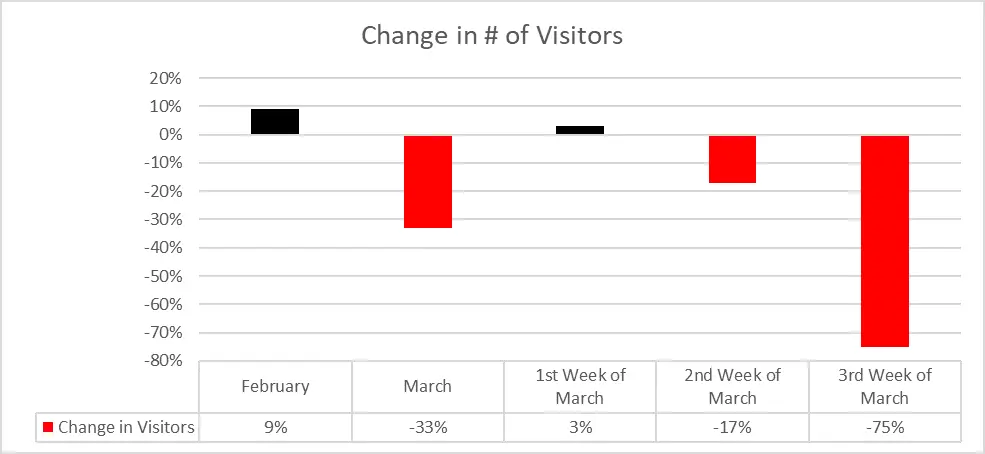
Last week using data from Advan we showed the impact of Covid-19 on retail real estate. Our analysis this week looks at the impact of the virus on office real estate. Using data from Advan that tracks anonymized cell phone movement over time, Eigen10 Advisors examined the change in foot traffic for a New York City office building. The building’s vacancy rate did not change significantly between first quarter 2019 and 2020, from low single digits to mid-single digits.
2 minutes
Tracking Real-Time Economic Changes and Property Impact

Tracking Real-Time Economic Changes and Property Impact

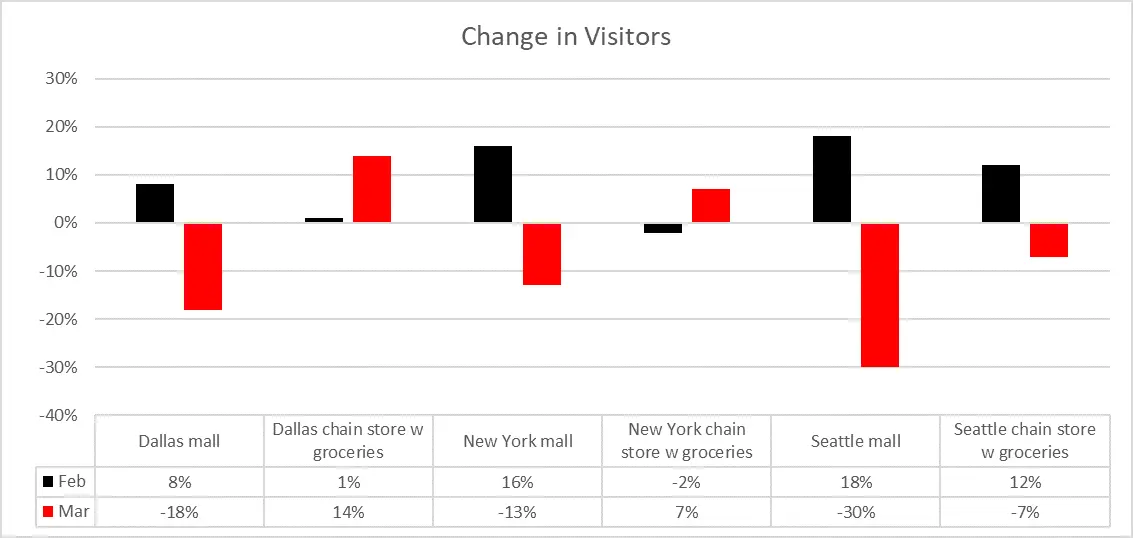
The coronavirus pandemic that is reverberating across the country and the globe has impacted commercial real estate in ways unforeseen from previous “black swan” events. This impact has not been even across sectors or markets or even subsectors within a property type. Fortunately, with today’s technology and analytics we are able assess some of the impact as it is happening rather than waiting in arrears for the data. Using data from Advan that tracks anonymized cell phone movement over time, Eigen10 Advisors examined the change in foot traffic at a sample of different types of retail centers in different markets.
4 minutes
Will CostCo benefit from stockpiling?

Will CostCo benefit from stockpiling?

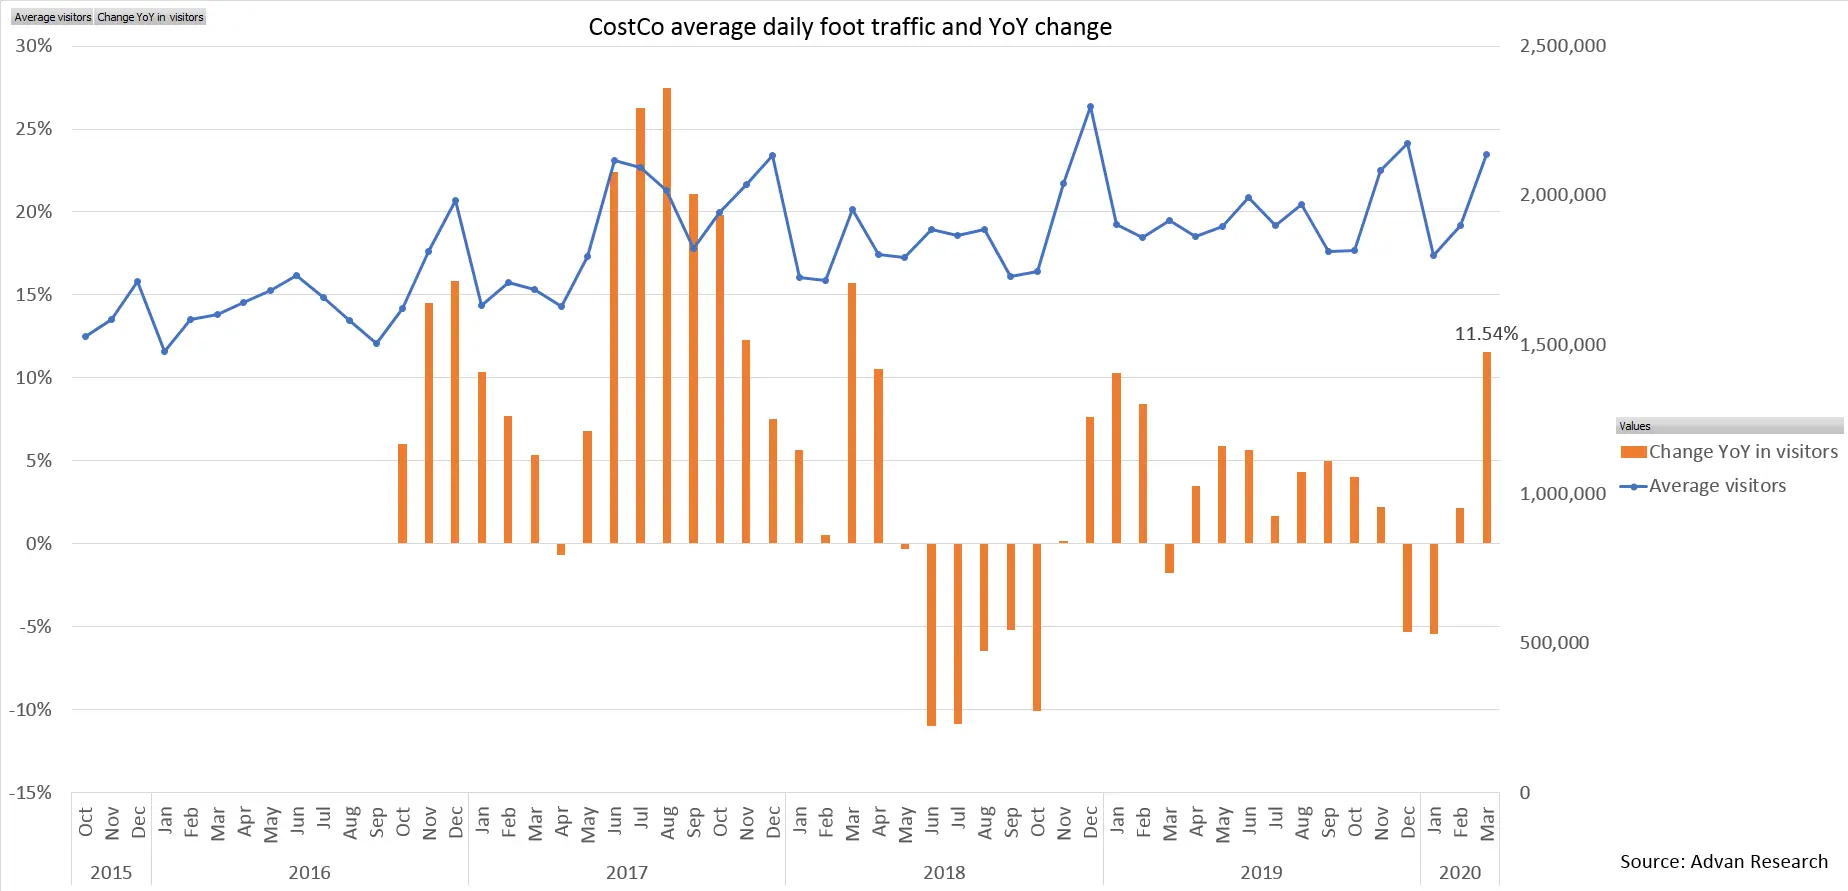
Recent news reports have highlighted an increase in foot traffic for CostCo as the spread of the coronavirus spurs people to stock up on essentials. Some analysis has put the number of visitors to CotsCo stores in the US up 72% year-over-year. At Advan, we ran a detailed analysis of true foot traffic at CostCo. The graph below shows average daily traffic for each month since October 2015, with year-over-year changes overlaid.
2 minutes

Black Friday is Holding Strong, but not everyone benefits equally

Department Stores, Restaurants, Malls, all continue growing their traffic on Black Friday on a year over year basis. The growth rate has decelerated a bit, but it’s still in the healthy double-digit numbers, from an already high base. Only Hotels showed negative growth, but less so than in prior years – a weighted average of -1% vs -3% and -2% in 2018 and 2017 respectively. Below are a couple of graphs that illustrate the traffic.
3 minutes

Miles Driven and Trucks Miles Driven: macro indicators

One of the interesting things you can do with access to anonymized, large scale and accurate cellphone location data, is to measure traffic patterns. Consistent with the Big Data theme, we decided to compute this across the whole US, to measure Total Miles Driven. Total Miles Driven is estimated by the Federal Government (aka “FRED”) in a monthly report, which is generated with about a 35 day delay (e.g., the September total miles driven is published in early November).
2 minutes

Freedom: priceless

It comes in many forms: Speech. Movement. Draw within the lines. Wait, scratch that last one. We didn’t like that last one either. When it comes to measuring foot traffic, trade areas, migration patterns, demographics, cross traffic, and in general get behavioral metrics from mobile location data, yesterday’s state of the art was to get canned results on some buildings or venues someone else has decided you might be interested in.
3 minutes