 LOGIN
LOGINAuthorities around the world are working hard to understand how people are altering their behavior as rules around social distancing begin to change.
Gathering data on where people are congregating is a valuable measure for understanding risks and calculating the likelihood of a second wave of infections.
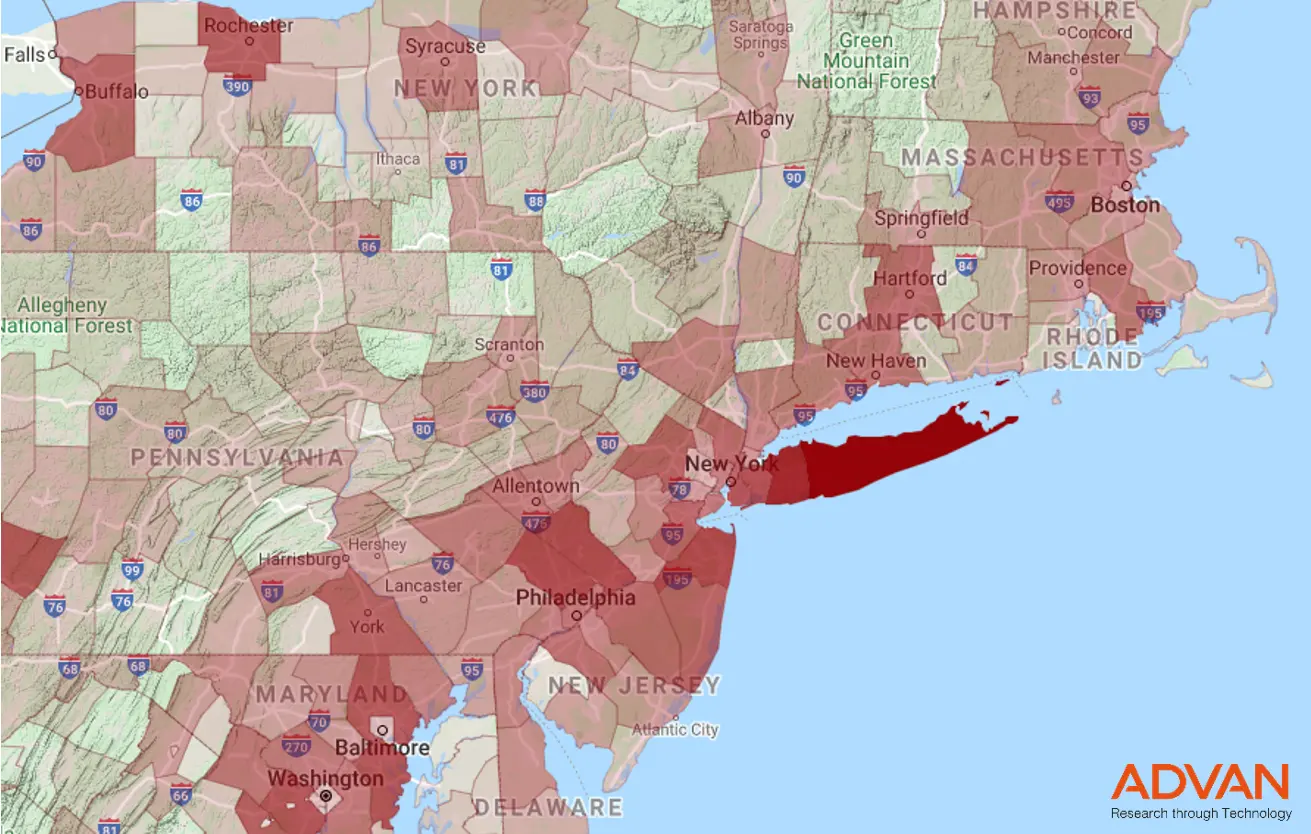
To help provide these insights, we developed our Hotspots map. We define a Hotspot as a city block in which more than 50 people are gathered at the same time for more than 15 minutes - excluding homes and other residences.
In order to provide more granular information for local towns and other authorities we have enhanced our interactive map to show Hotspots by county across the US.
The increasing dark areas of the map show the growing frequency with which people are gathering in groups of 50 or more, for longer than 15 minutes at a time. Note how Long Island is more crowded than New York City!
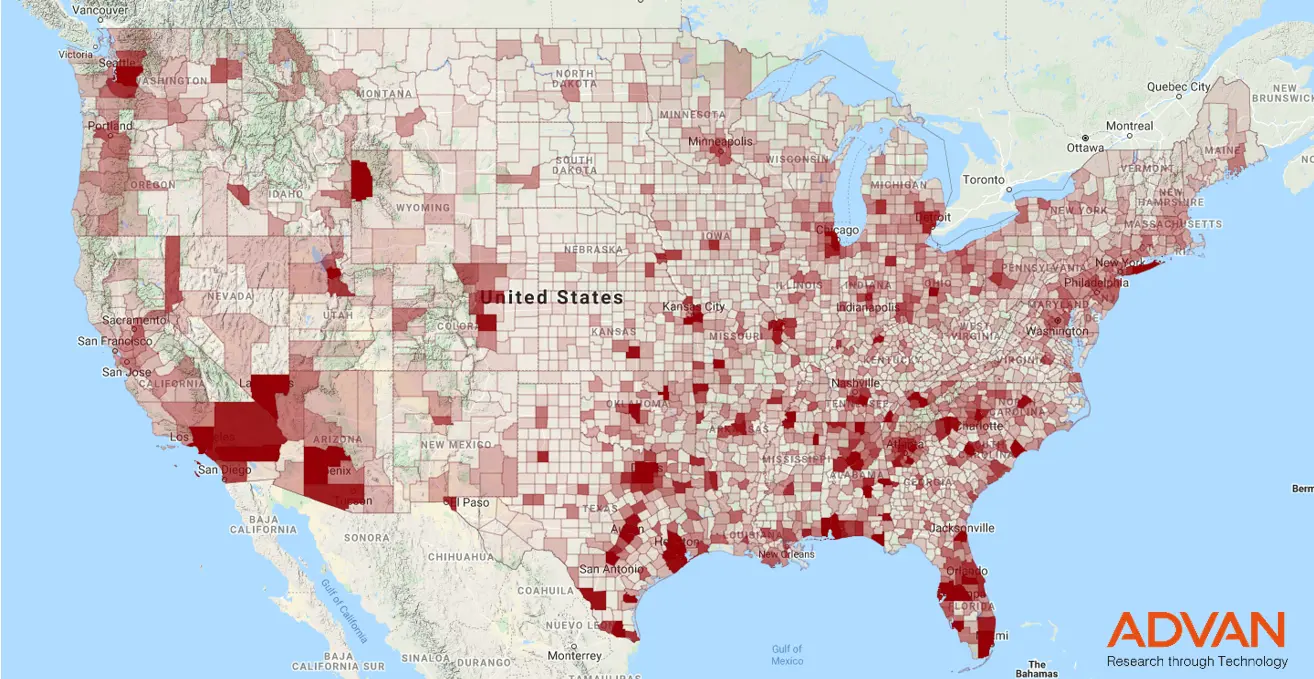
Looking across the US we see a general trend of more social gathering in the southern states:
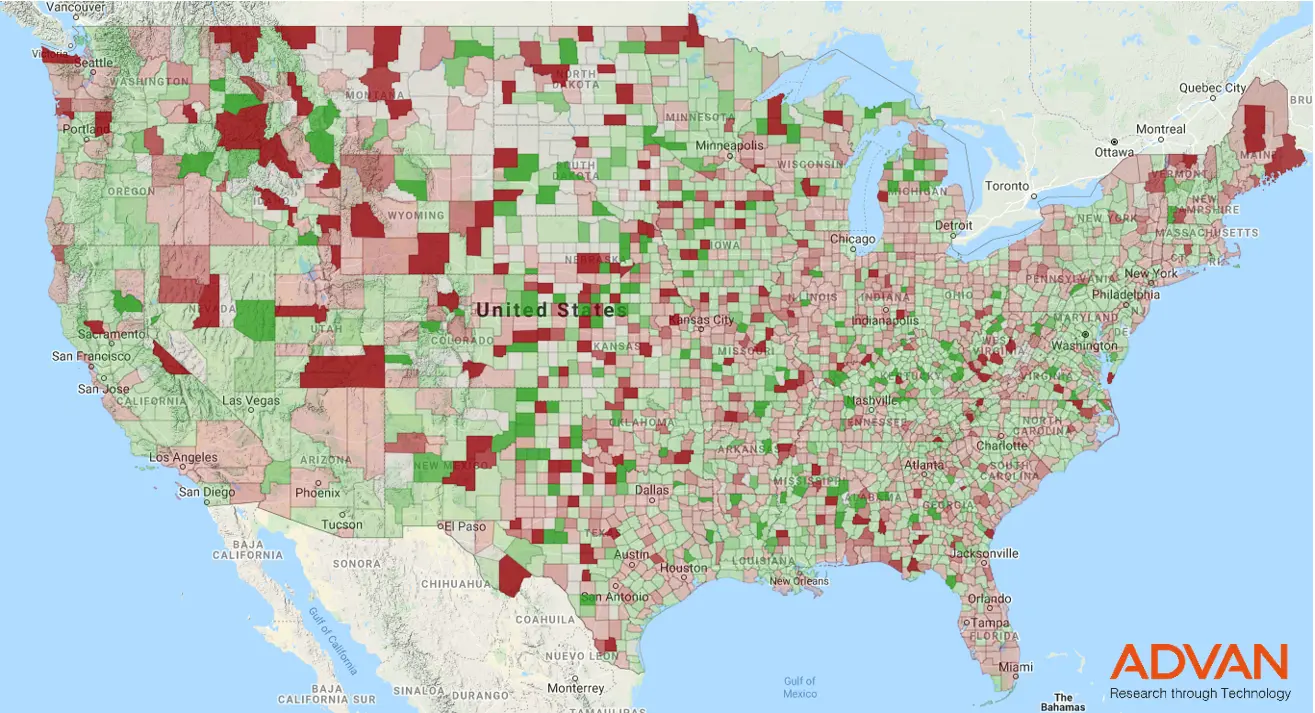
And looking at the week-over-week difference we can see which areas are starting to open up first. Red = more social gathering than last week, green = less social gathering. We can see Washington, Maine, Montana are starting to open up, where in most states people are proceeding with caution:
See the full interactive map for more details.
For more detailed data please [contact us](https://advanresearch.com/contact?message=Can you please send me more information about hotspots?).