 LOGIN
LOGIN

Follower Friday’s note on Walmart US’ Q2 results, here we dissect Sam’s Club quarter with a compare / contrast to BJ’s Wholesale and Costco, while also reflecting on Target. The table below shows the top-line KPIs for the four. Costco’s comp-sales and comp-transaction outperformance is notable; as readers will know, that outperformance stems from its strong private brand offering, the Costco member’s high affluence, and our “thrifty K-shaped economy” and consumer mood. Costco’s faster pace of membership income growth stems from its membership fee increase, excluding that puts the YoY increase in line with its peers. On membership at Sam’s, management shared, “Sam’s Club continued to see steady growth in member counts, renewal rates, and increased penetration of Plus members.” BJ’s CEO Bob Eddy said, “Our membership base continues to grow, and I’m happy to announce that we reached the 8 million member milestone this quarter, representing 55% growth in our membership base since our IPO seven years ago” (and up from less than 7.5M last year). Eddy went on to say, “Growing the number of members and retaining them at high levels is an impressive feat, but we are also improving the member mix, signing up a greater percentage of higher-tier members who qualify for our best-in-class rewards, both in the club and at the pump. In the second quarter, higher tier membership penetration continued to set records, improving 50 basis points sequentially to an all-time high of 41%…”
(Of note, for the club channel vs. other big-box categories, observed visits has a weaker correlation to reported comp-transactions as the fuel business introduces a lot of noise given the volatility in gas volumes, which stems from the volatility in gas prices. Fuel is a big business and makes up around 13% of US revenue.)
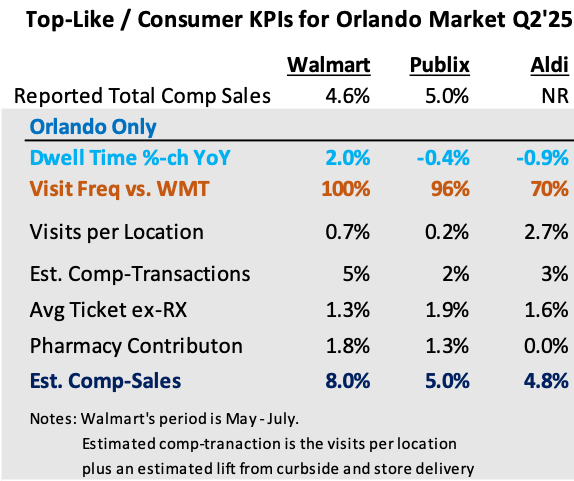
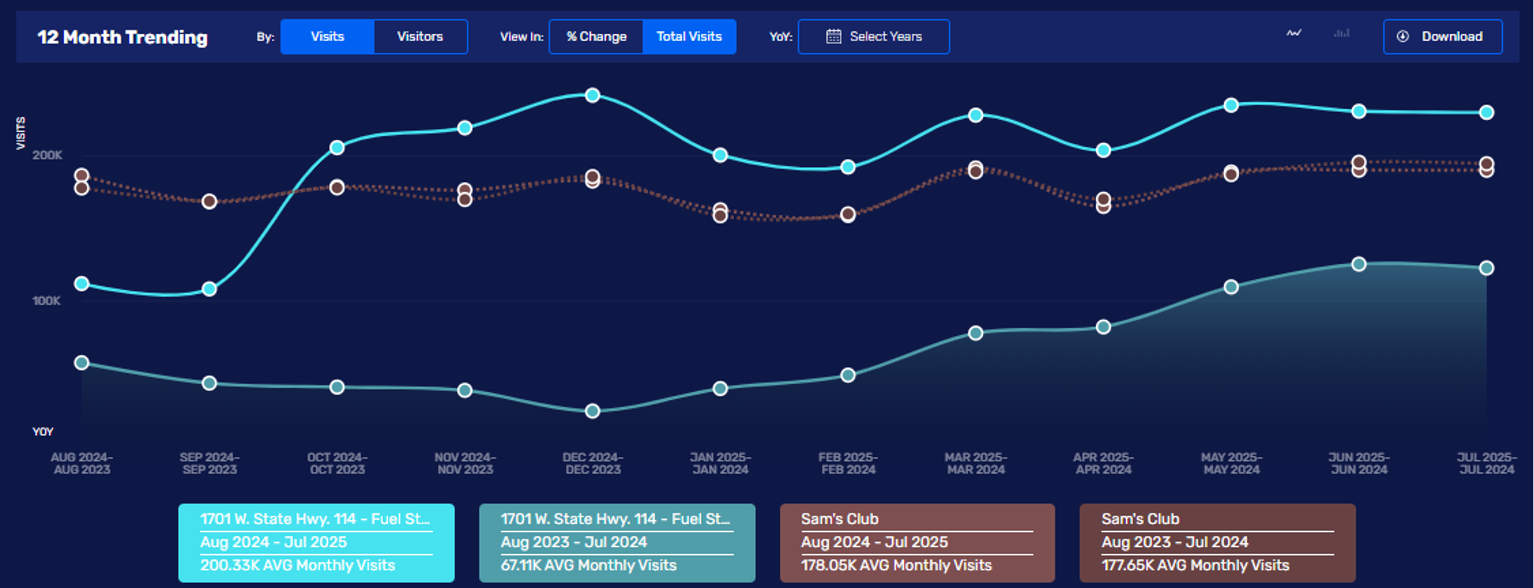
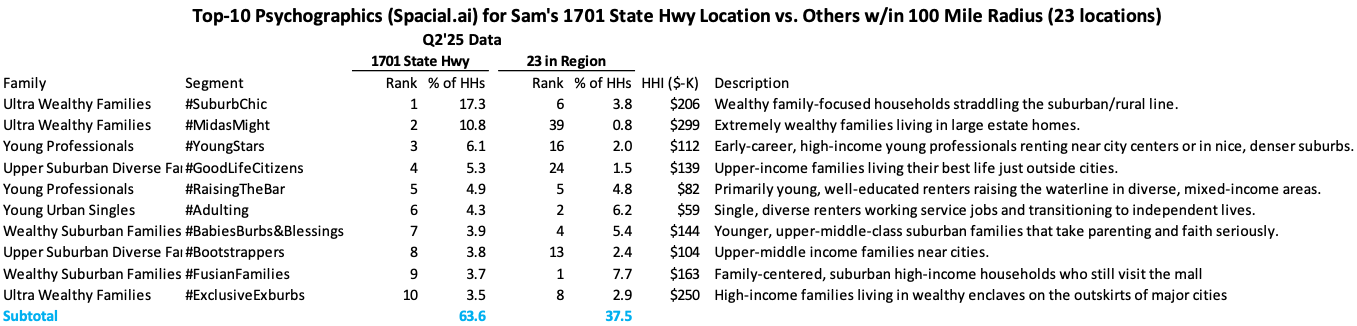
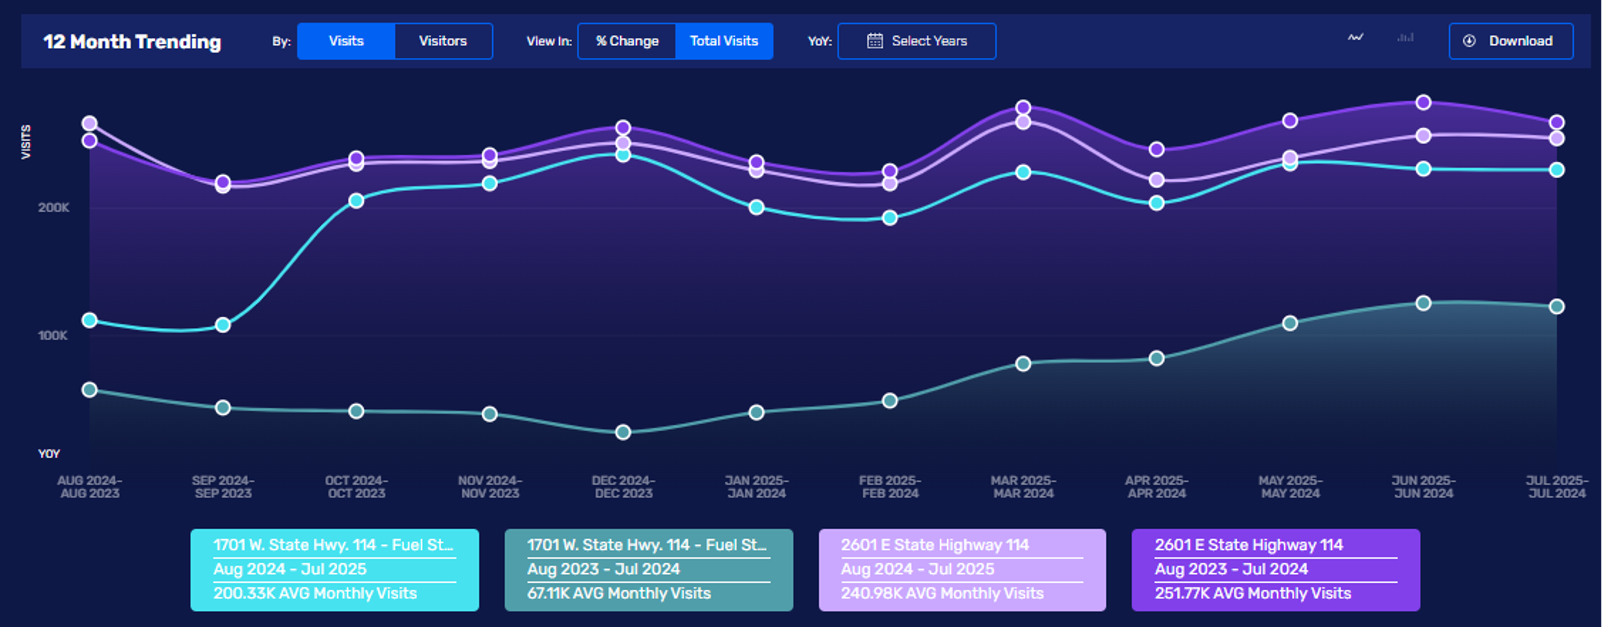
Like Walmart, Sam’s is benefitting from its “contemporized” sales mix and convenience; store-delivery increased 50% YoY and it now makes up 5% revenue (per our estimate). Curbside increased double-digits. As a contributor to Sam’s total business, e-commerce, which includes store-delivery, curbside, Sam’s.com , and adverting, is a surprisingly large 18% of revenue (ex-fuel). That’s a lot of contemporization! By contrast, store-delivery and curbside are relatively small businesses for Costco. If we add those contributions to Sam’s comp-transactions, the figure increases to +3.9% and similar to Costco’s performance. BJ’s is similar to Sam’s with rapid growth in digital, including the impact on observed visits. Advan estimates that it has reached 15% of non-fuel revenue for BJs, and over 90% of the digital sales are fulfilled by the clubs with services like BOPIC, ExpressPay or same-day delivery. CEO Eddy said, “Our focus on convenience is shown in our digital results with growth of 34% this quarter and 56% on a 2-year stack basis, driven by consistently robust BOPIC and same-day delivery expansion and rapidly increasing penetration of ExpressPay. Our digital adoption sets new records every quarter and our app usage continues to grow with more than half of our active members now regularly using the app.” Readers will remember that we’ve been highlighting units per transaction (UPT) as a critical metric to monitor as it typically precedes directional changes in comp-traffic, Sprouts / Grocery Outlet were ’23 / ‘24 examples of this to the + / -. The table’s across the board increase in dwell time implies higher units-per-transaction (UPTs) and successful merchant execution for all four brands. For Sam’s, Scan-&-Go penetration increased 600bps YoY, which ceteris paribus, is a dwell time moderator. Thus, Sam’s +200bps improvement in UPTs is better than what the increase in dwell time implied. Sam’s CEO Chris Nicholas said, “And that’s one of the big reasons we’re trending so much younger with our new members that we’re acquiring. So I think it’s online, and I think it’s physical too, and I’m excited about what the future looks like for Sam’s Club.” Target’s comp underperformance stemmed from weak traffic and increased markdowns, not UPTs, which improved QoQ. Last fall, Sam’s opened its new club format in Grapevine (1701 W State Hwy 114), which doesn’t have traditional checkout POS; it’s solely Scan-&-Go (vs. approx. 40% of transactions chainwide). The location also has twice the number of curbside spots (32) of a typical club location. As shown in the chart below, Grapevine does 12% more traffic than the average of the 23 Sam’s in the region (100 mile radius). Due to the Scan-&-Go, its dwell time is 4% less than the region’s average. The Grapevine location has a more-affluent customer than the average; it’s median HHI / percent-of-households with >$125K in HHI is $142K / 46% vs. $102K / 28% regional average. (Remember that as the affluent out-spend the average, their contribution to the location’s sales will be far larger than these %-figures.) Looking at the differences one layer deeper is shown in the following table of top-10 clusters out of Spacial.ai’s 80 clusters. This location’s customer mix is very idiosyncratic to the other Sam’s in the regions, and its shopper mix is far more similar to the nearby Costco (2601 W State Hwy 114). The third figure below shows this Costco’s monthly visits over the past year (light purple), to the base period (dark purple), and since the Sam’s opening, it’s been down each month with the gap widening. Prior to the opening, the Costco was consistently up YoY. In Q3’24, 32% of this Costco’s visitors also visited the Sam’s; by Q2’25, this had increased to 50%. That’s a lot of competitive encroachment and it implies a lot of wallet share capture by Sam’s. Sam’s just opened another one of these clubs in Tempe, AZ, with more to follow. There isn’t a nearby Costco to the opening, but Target is nearby.
On BJ’s contemporization of its fresh business; they called it “Fresh 2.0,” Eddy said, “Fresh 2.0 is perhaps the best illustration of our transformation in the past couple of years. Really was a true 360-degree program where we looked at our entire produce business and tried to say, how do we make this thing the best we can? And obviously, as we’ve talked to you about it before, we made changes across the business in terms of the spec and quality of what we provide and how we merchandise it, how we talk to our members about the value, how we promote it, how we train our team members, where we locate it in the clubs, all sorts of different things change. And I would call it an overwhelming success in the first year. We find ourselves now, as you say, starting to lap that. And we still see perishables driving the business, which is fantastic. Grocery had a good quarter for us with a three comp. Perishables led that and was roughly double that comp. And it was a tremendous unit growth story embedded in there that was really driven by the Fresh 2.0 initiative in large degree.” (Something for Target to study.) Lastly, looking at the performance in general merchandise results, Costco’s general merchandise increased high-single-digits. Sam’s was less punchy with general merchandise increasing only low-single-digits, hindered by furniture, patio, and consumer electronics; however, management implied accelerating momentum for general merchandise. CEO Nicolas shared, “We brought 50 new brands into general merchandise this quarter. And these are brands that maybe Sam’s Club wouldn’t have gotten before. It’s just this last couple of weeks, Vera Bradley, Outdoor Voices, CurrentBody, like these are call interesting items and our merchants are finding them, and it’s bringing in the kind of members that you’d hope you would see.” By contrast, declines in general merchandise were seen at BJs (-2.2%) and Target (-2.4%). BJ’s Eddy said, “…results being impacted by both the weather and macro factors that I noted earlier. Certain higher-ticket discretionary categories … such as recreation and lawn and garden experienced double-digit declines in comp sales.” (You can find our analysis on Target here .)