 LOGIN
LOGIN
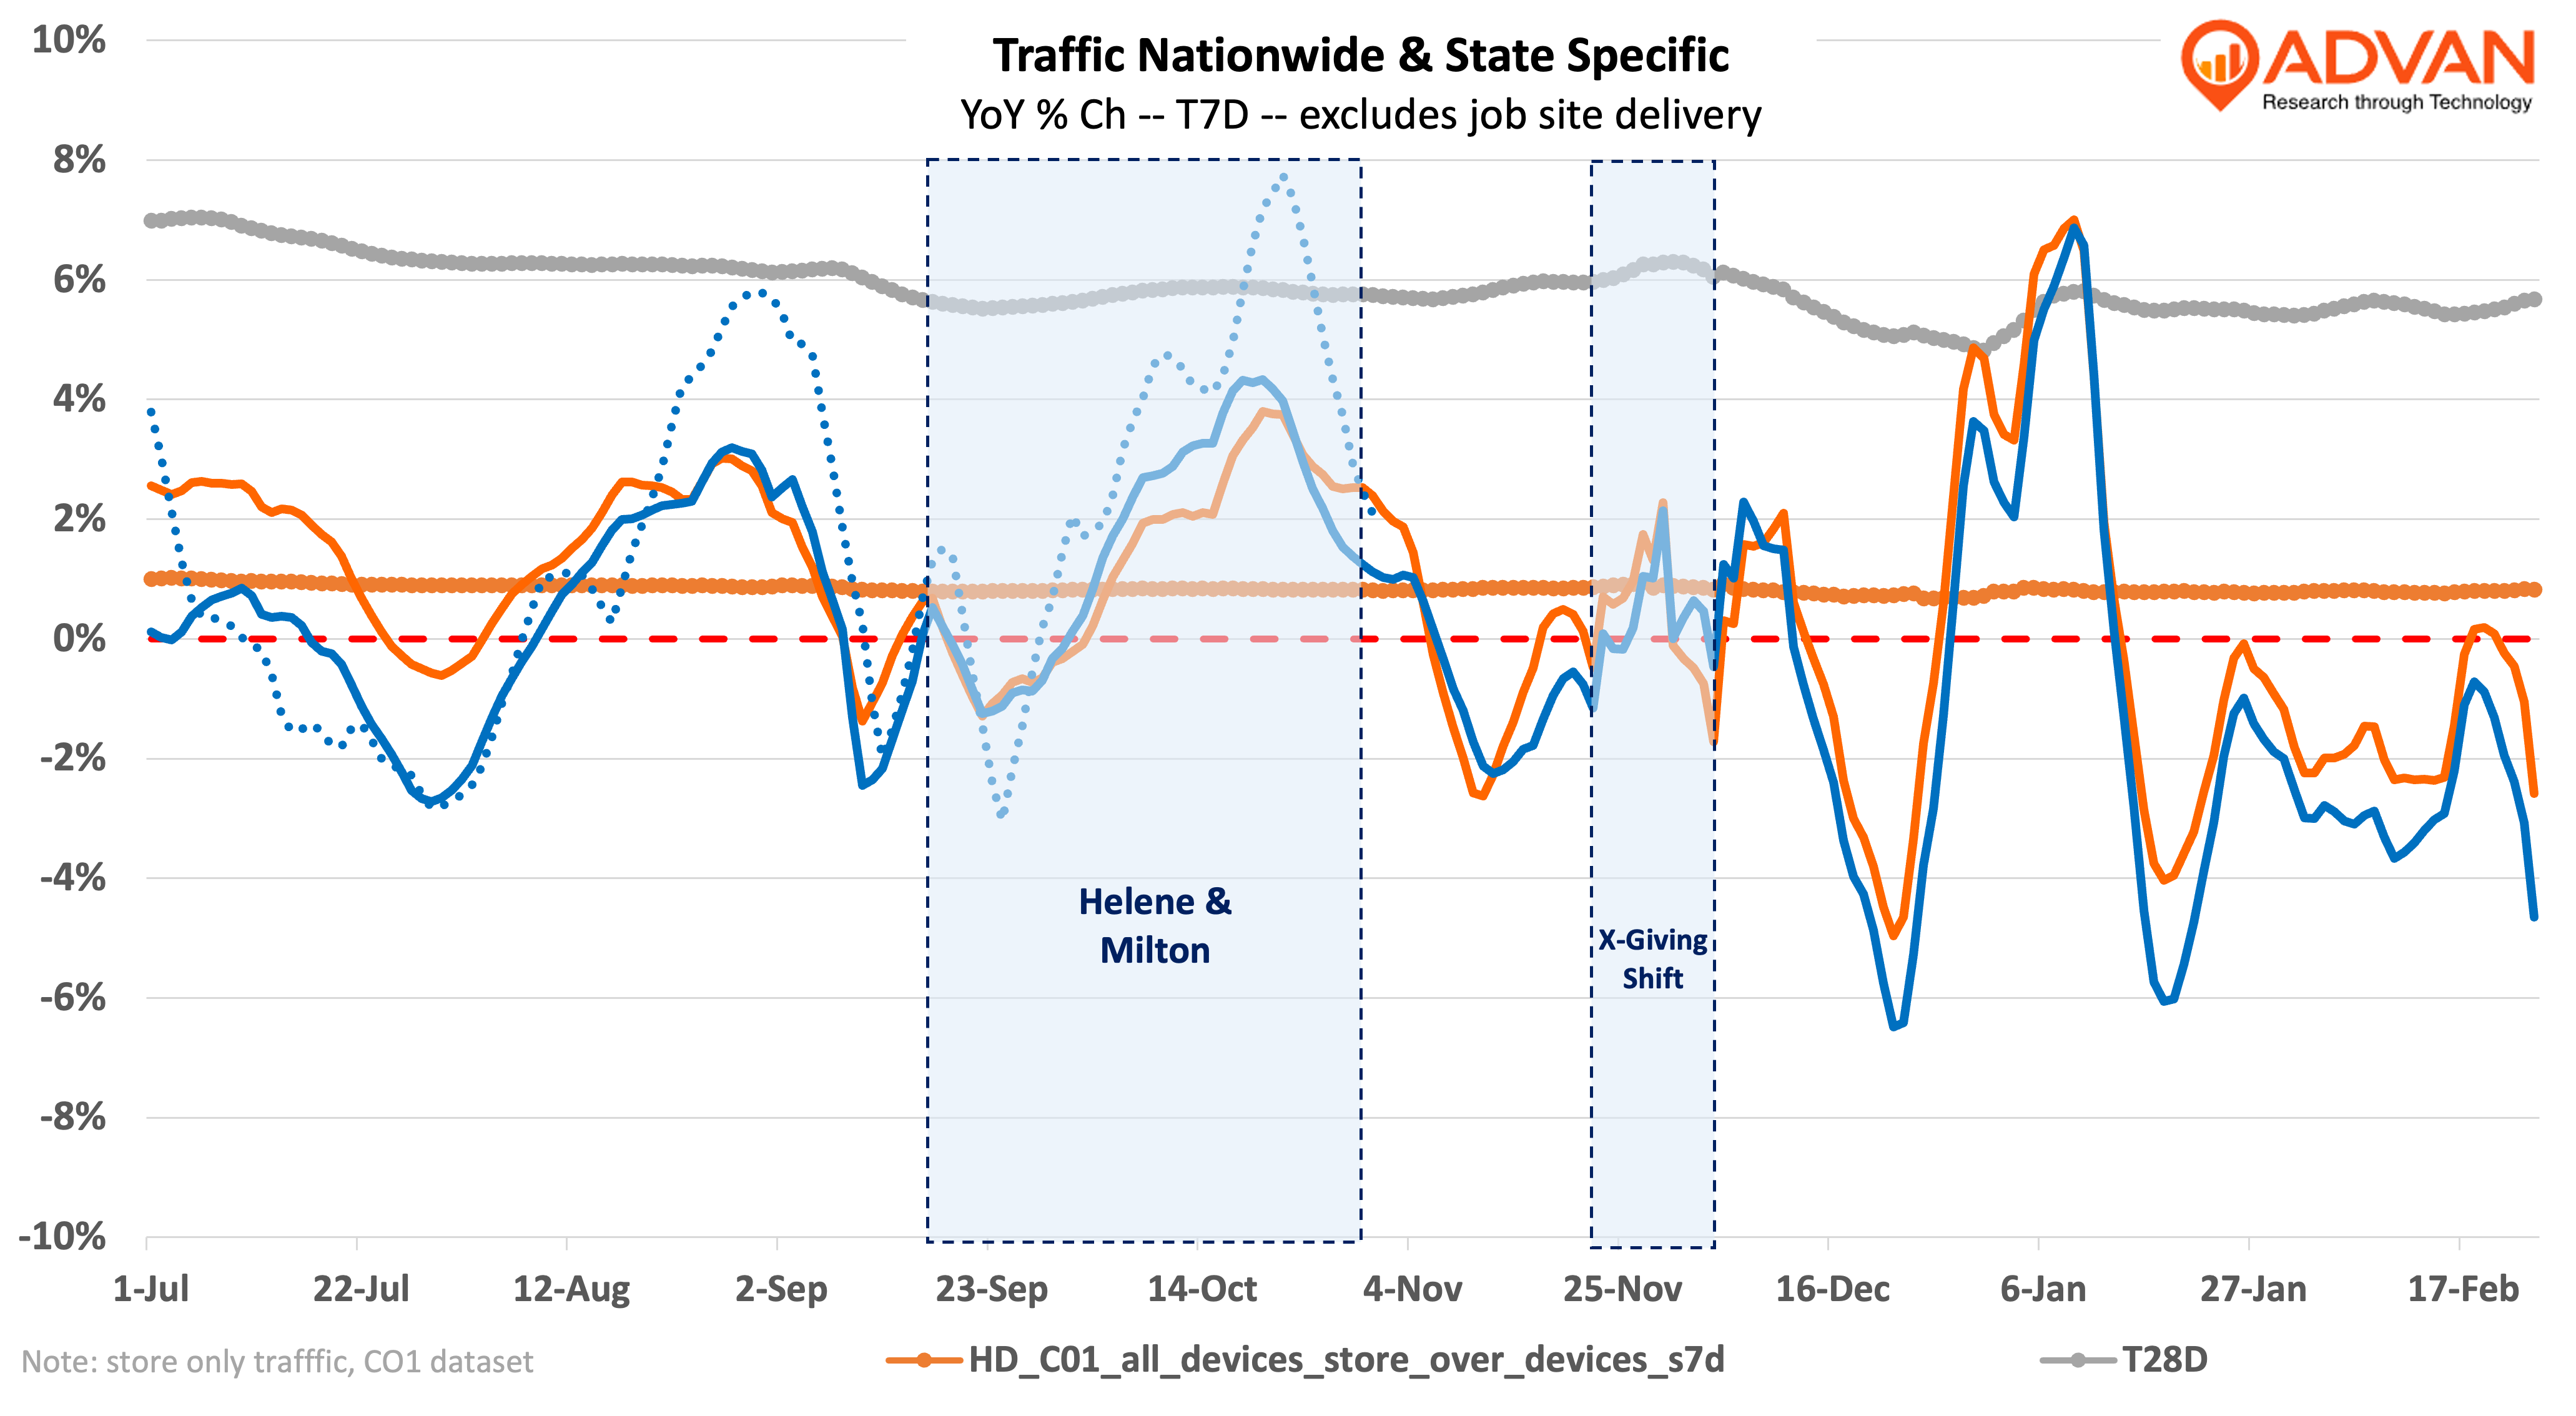
Lowe’s and Home Depot both noted a very strong December that benefited due to calendar shifts to the detriment of November and January. As shown in the chart above, the traffic in the two weeks following Christmas was very robust. Also of note, the deep drop in traffic ahead of Christmas reflects the absence of one weekend between Holiday-2024 and -2023. (The basket size is up a lot during this period.) Bad weather was also a material negative for January. (Given that it’s a smaller month, larger anomalies create bigger percentage rate impacts given the smaller denominator.) That bad weather has continued into February.
Lowe’s Q4 release read, “Comparable sales for the quarter increased +0.2%, driven by high-single-digit Pro and online comparable sales, strong holiday performance, and rebuilding efforts in the wake of recent hurricanes, partially offset by continued near-term pressure in DIY discretionary spending. The sales increase was ahead of Advan’s -1.6% estimate (+/- 140 bps T6Q Moe, 98% T6Q correlation) with the outperformance likely due to the stronger channels which have higher average ticket sizes. (Pro and online generally have a lower gross margin rate and so it’s impressive that Lowe’s consolidated gross margin was flat.) Supporting our view is the 130-bps improvement in comp-ticket to a 1.5% increase. Additionally, comp-sales by large ticket size (>$500) were down only -0.6% versus -2.8% in Q3. (These sales have been down each quarter since 2022).
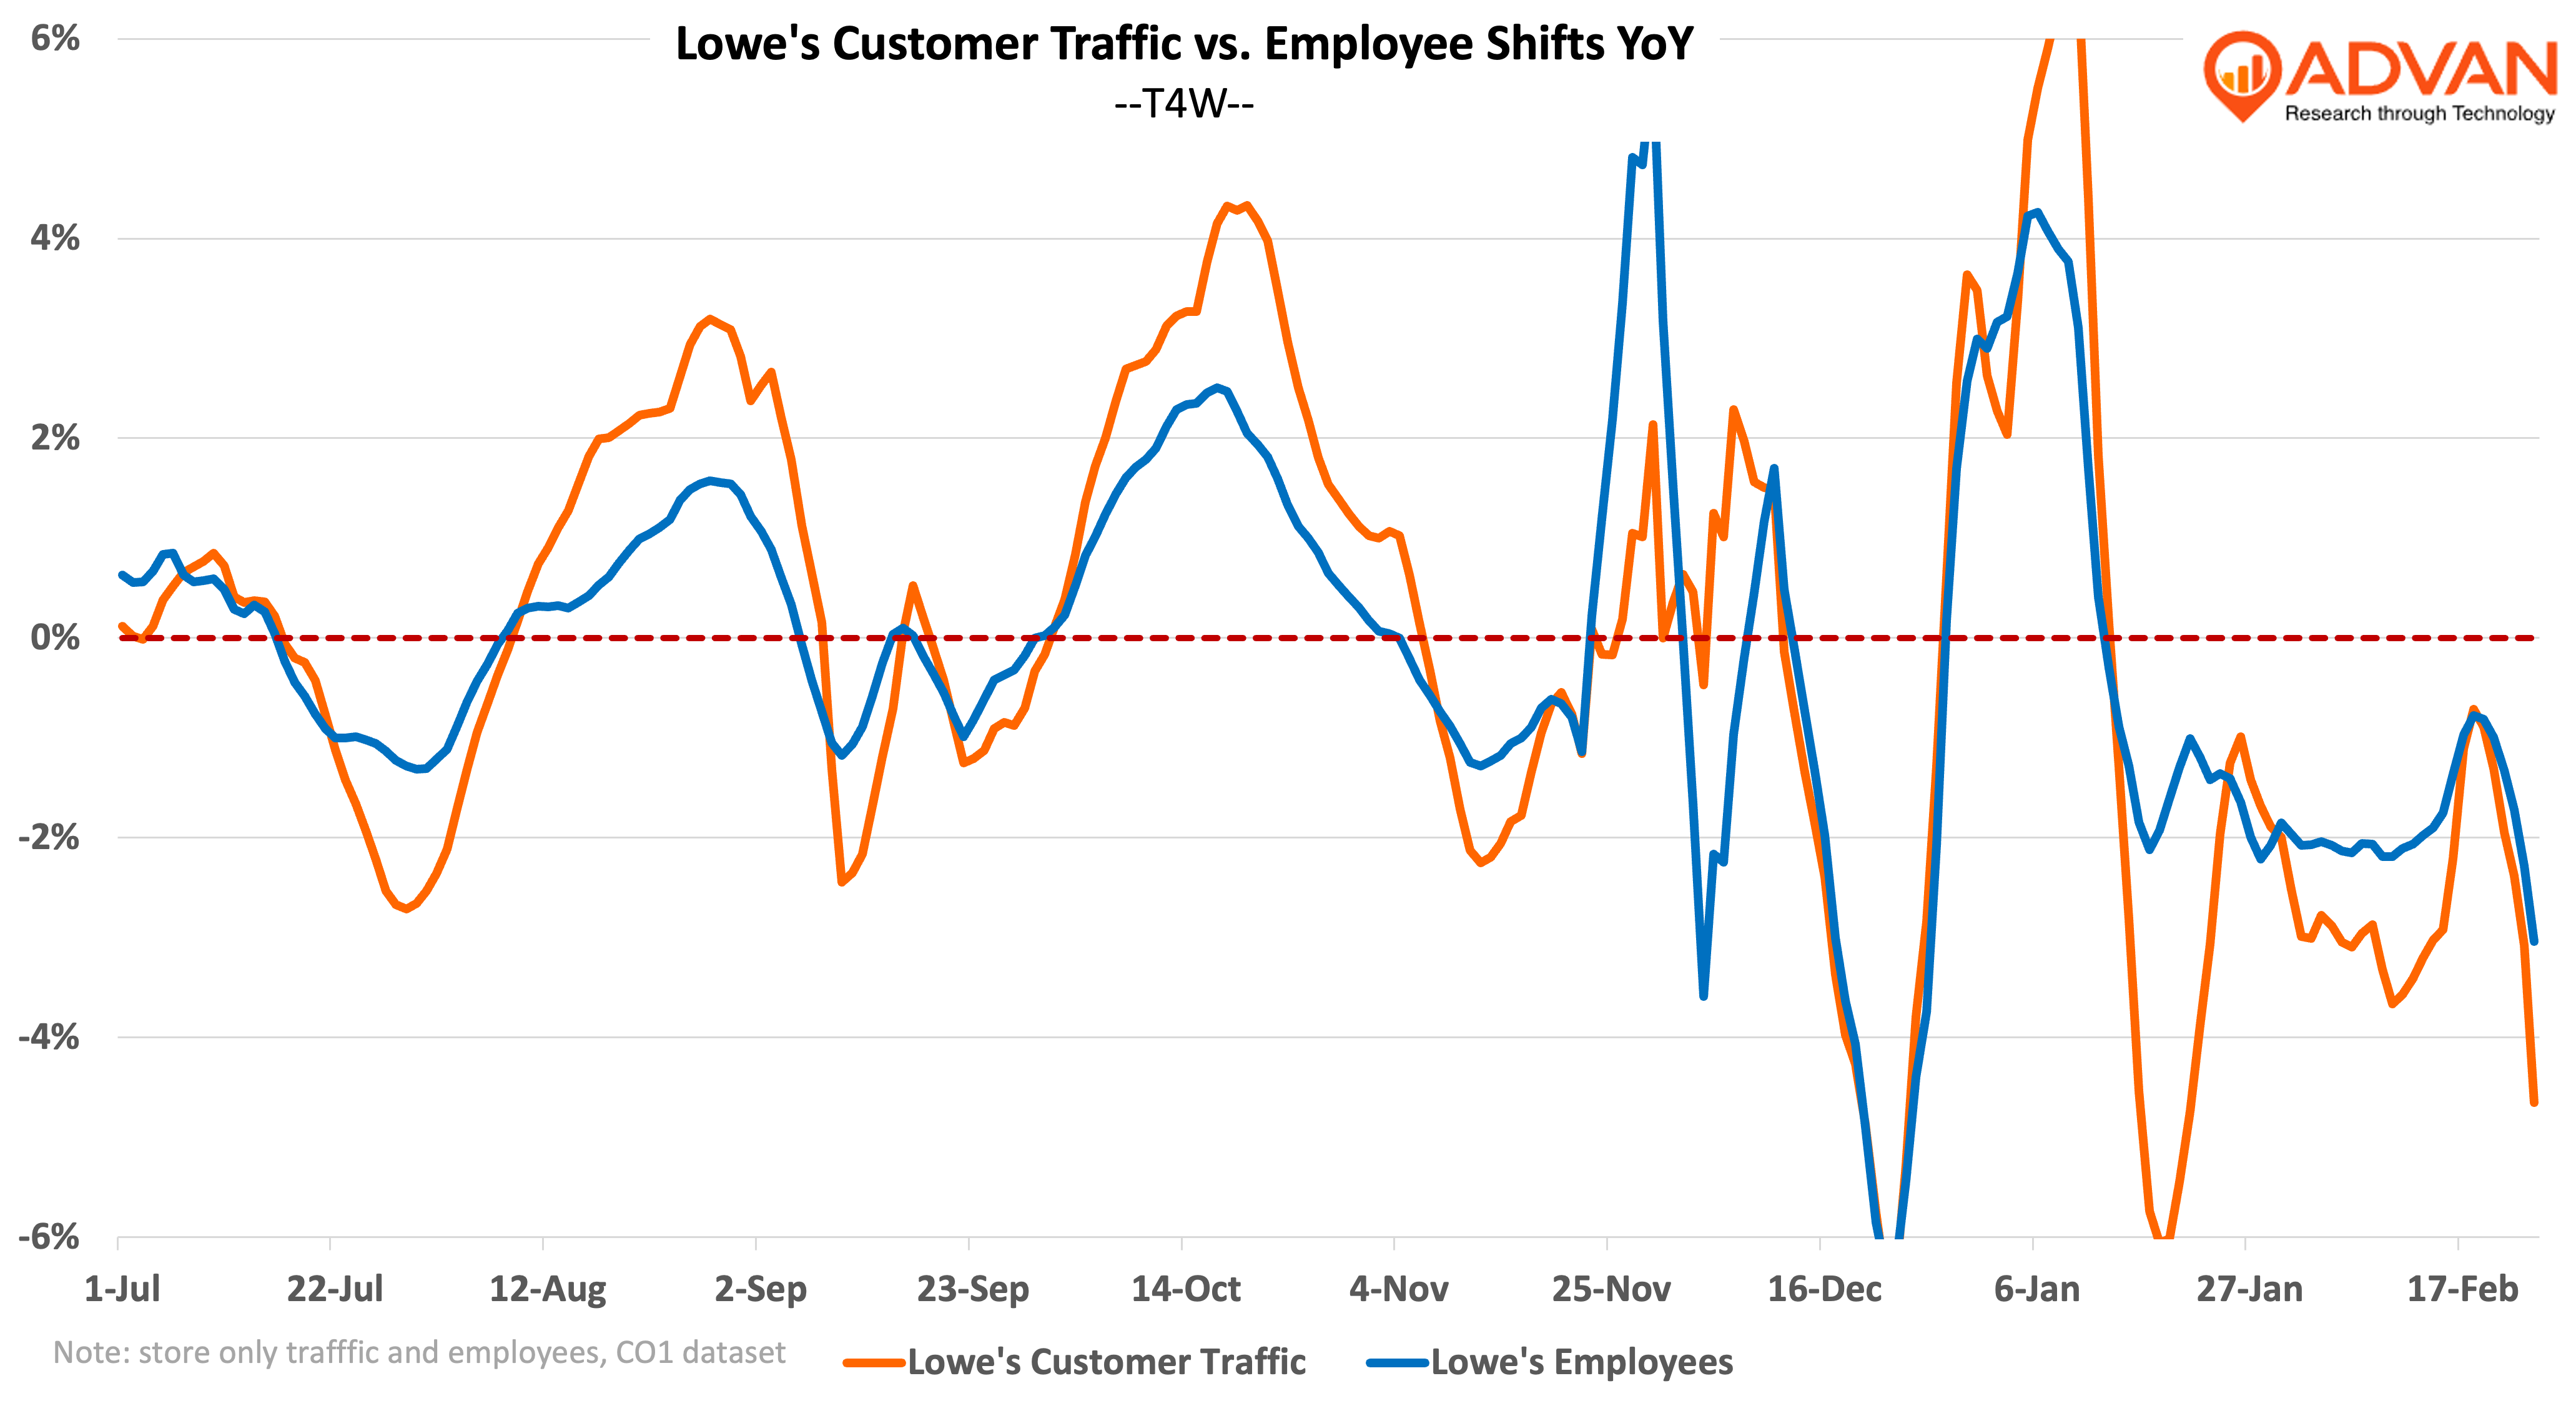
Lowe’s reported upside on earnings with positive leverage on SG&A expense at 36 bps (Home Depot did not) and Lowe’s SG&A per store declined -2%. As shown in the chart below, the spread between traffic growth was pretty consistent, save the calendar noise and the poor weather in late January. During Q3 the spread was more consistent, and Lowe’s reported more leverage (60 bps) for that quarter. For the six-month period, excluding late January (where weather created noise), Lowe’s spread between the customer traffic and employee shifts averaged 41 bps; Home Depot’s spread was less at 28 bps. (Depot’s narrower spread is also noticeable in a chart. Let us know if you would like to Zoomeet about this analysis or anything else in this report.)
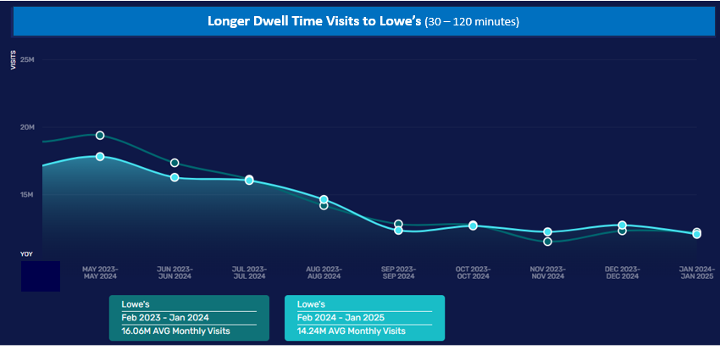
Looking at Lowe’s traffic trends one level deeper, we see an improvement in trend for longer duration visits, as we show in the figure below. (Home Depot is similar.) These visits are likely for larger ticket orders and DIY big-ticket projects. These longer visits were down sharply earlier in the year, but have since stabilized, including increases for November and December. The improvement is largest for Fridays, Saturdays, and Sundays, supporting our assertion that this is DIY driven (vs Pro driven). Looking at just visitor counts for the Friday – Sunday period and the longer dwell time, every month since August has been up, save September (hurricanes). Again, supportive of this viewpoint is the increase in comp-ticket and improving trend for big-ticket comps.
Lowe’s guidance for Q1 was for a flat to +1% comp-store sales increase and Home Depot’s guidance is a +1% comp-sales increase. Underlying the guidance at both companies is the expectation that the market will be “flat.” These outlooks embed the softer February that we see in Advan’s data. Lowe’s CFO Brandon Sink said, “Weather was a drag, in particular for January, impacted the month just north of about 150 basis points. That is pressing into, here, the month of February, which is we’ve seen particularly poor weather here over the course of the first 3 weeks. That is factoring into how we’re thinking about Q1 and full year…”
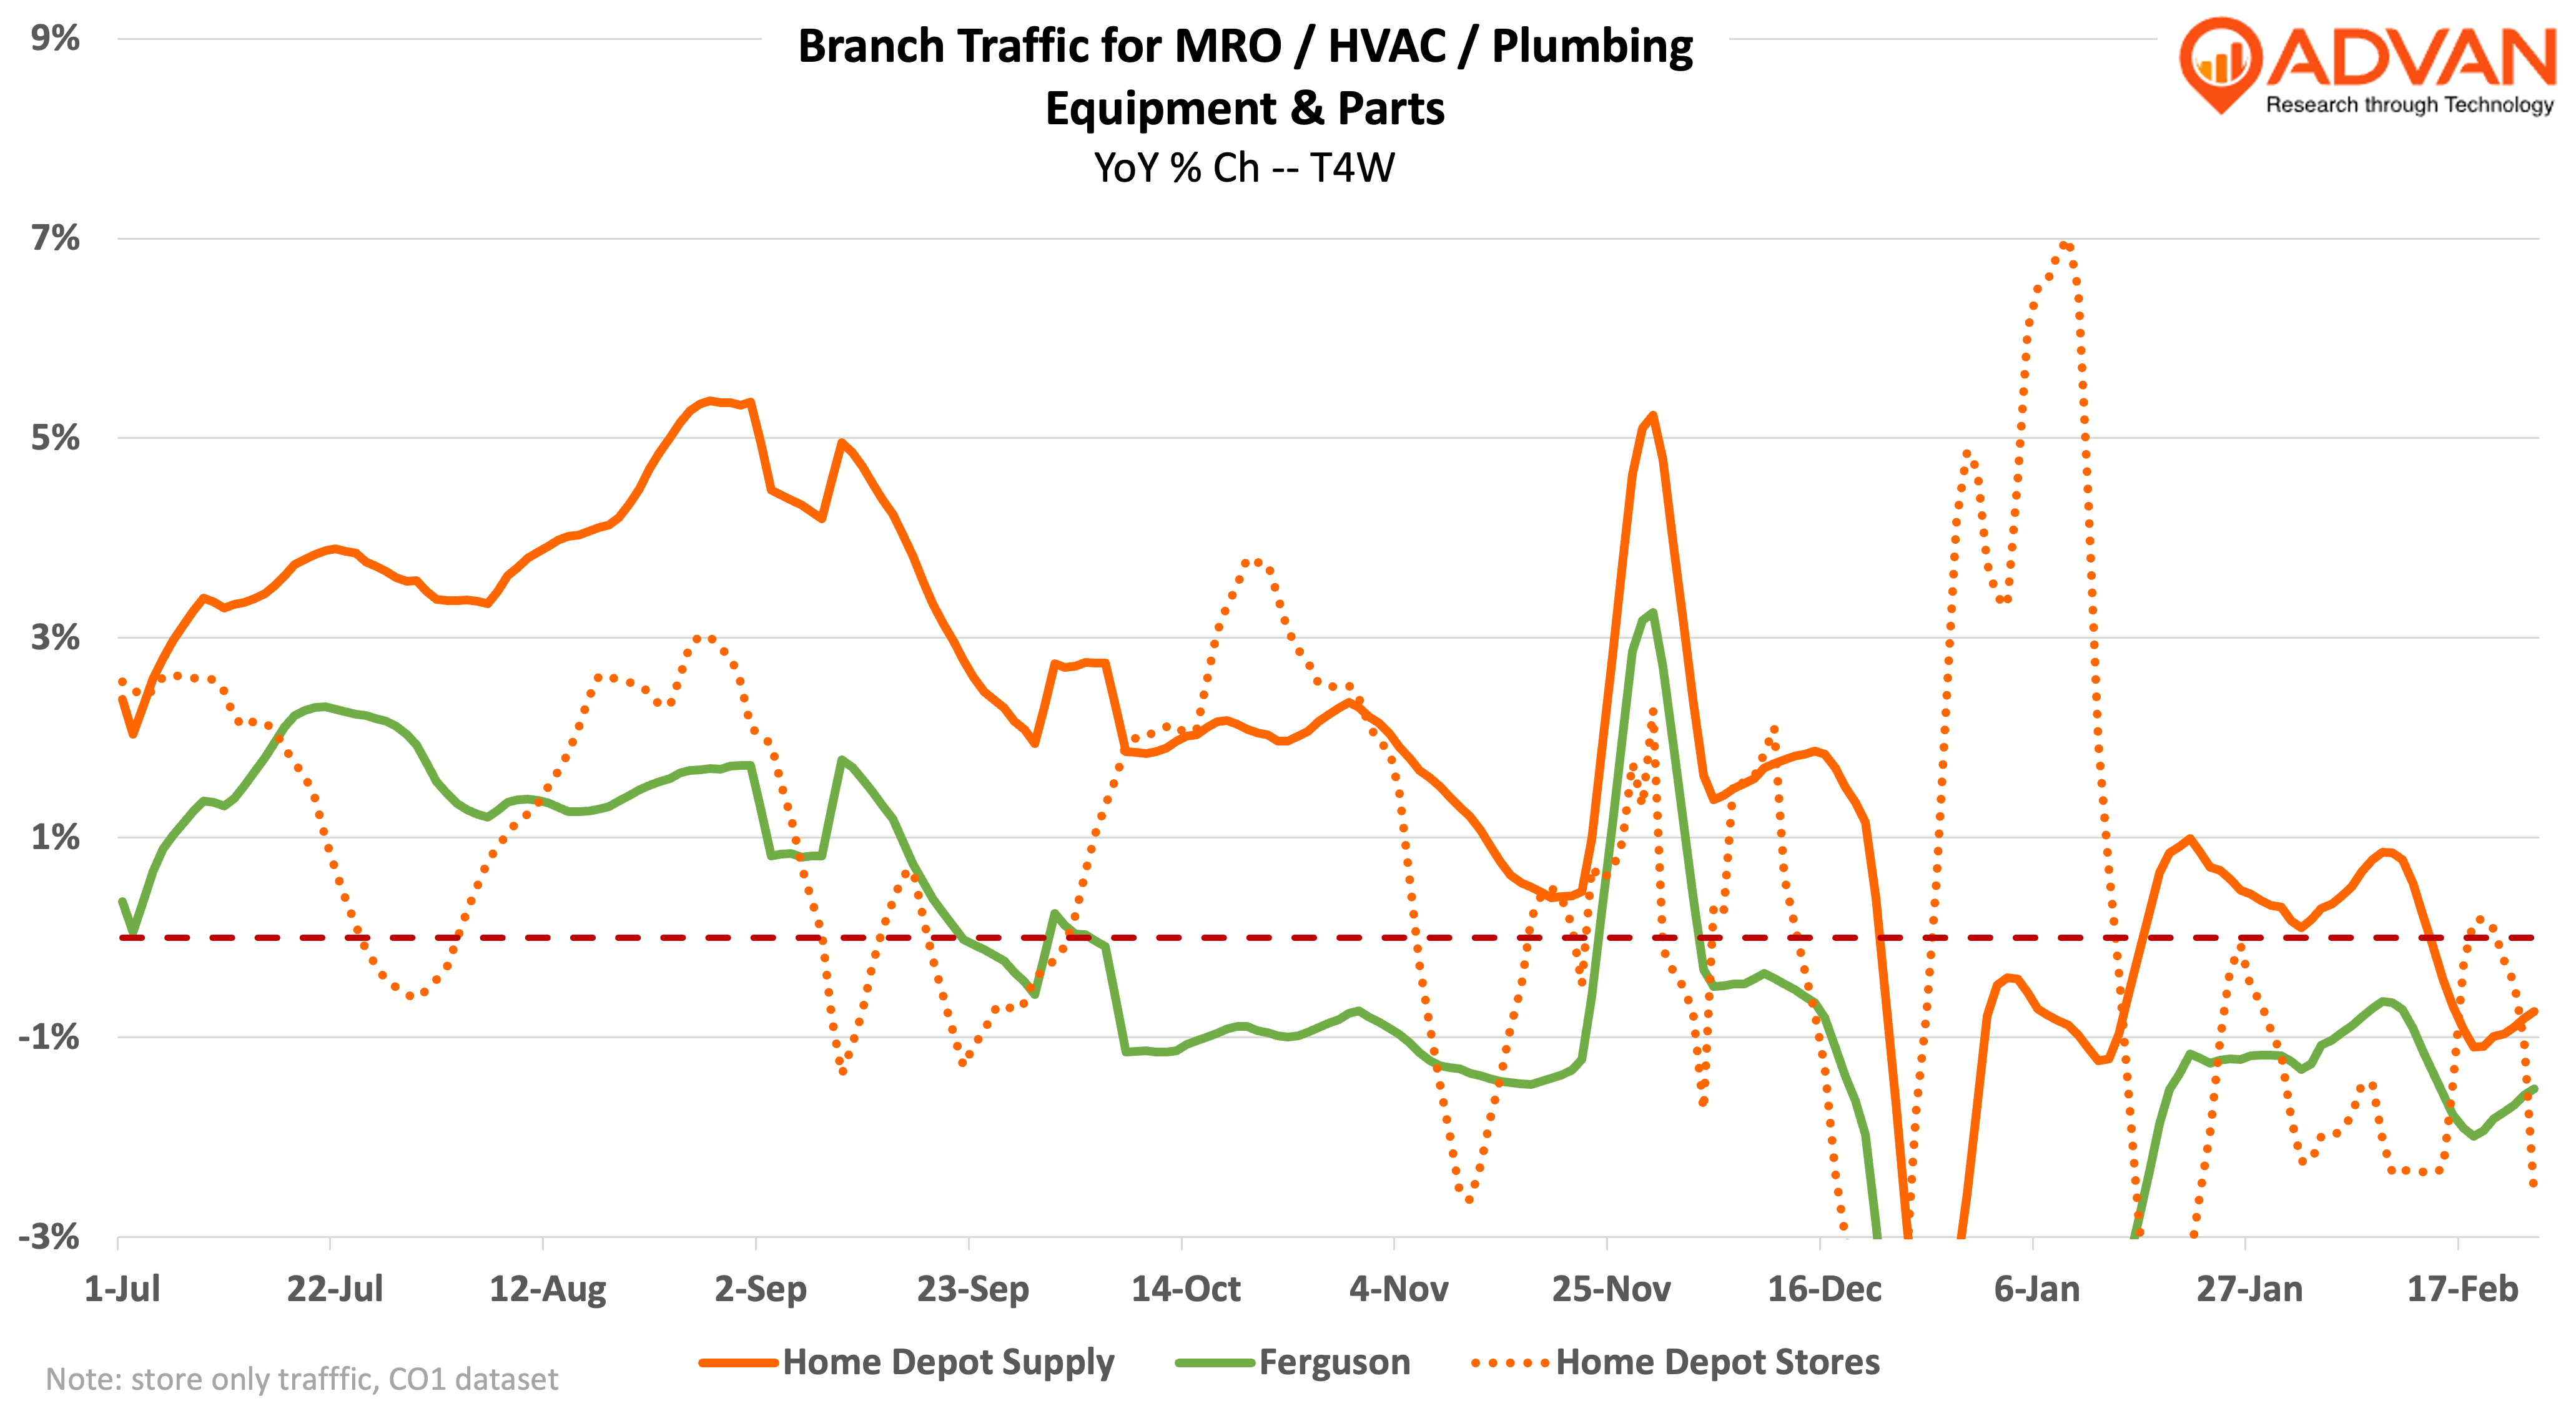
For fiscal Q4, Home Depot grew U.S. comp-sales +1.3%, albeit with -25 bps of gross margin pressure. (The comp figure includes HD Supply and Home Depot’s large job site delivery; store foot traffic doesn’t measure those businesses.) Given that the comp-sales increase versus 2019 (+30%) remains consistent with the year, inflecting from negative 1-year comps for the past eight quarters to positive (+1.3%) reflects the comparison base as opposed to an improvement in underlying home improvement demand. Home Depot’s Chief Merchant Bill Bastek said, “We were pleased with the performance we saw in categories such as appliances, building materials and lumber. However, we continue to see softer engagement and larger discretionary projects for customers typically use financing to fund the project such as kitchen and bath remodels.” Home Depot’s Pro business outperformed its DIY business; Advan also shows this in the stronger traffic trend to HD Supply’s branches vs. the Home Depot stores as shown in the chart below. Ferguson is a near-competitor to HD Supply, and it has underperformed HD Supply in visits. (We will come back on Ferguson and revenue when they report results on March 11th.)