 LOGIN
LOGIN

The underperformance of HD and LOW since we wrote about their improving results on August 20th is curious. Despite the 30-year mortgage rate declining from 6.6% to 6.3%* and favorable Q3 results from building product manufacturers and furniture / home-related retail, HD / LOW have declined and significantly underperformed the S&P 500. Also pointing to improvement is the NAHB’s remodeling index “which for the third quarter, posting a reading of 60, up one point compared to the previous quarter. With the reading of 60, the RMI remains solidly in positive territory above 50…” read the release . We don’t have a good explanation for the sizable underperformance; maybe it’s uncertainty stemming from last year’s hurricane comparison (difficult), or maybe it’s something else.

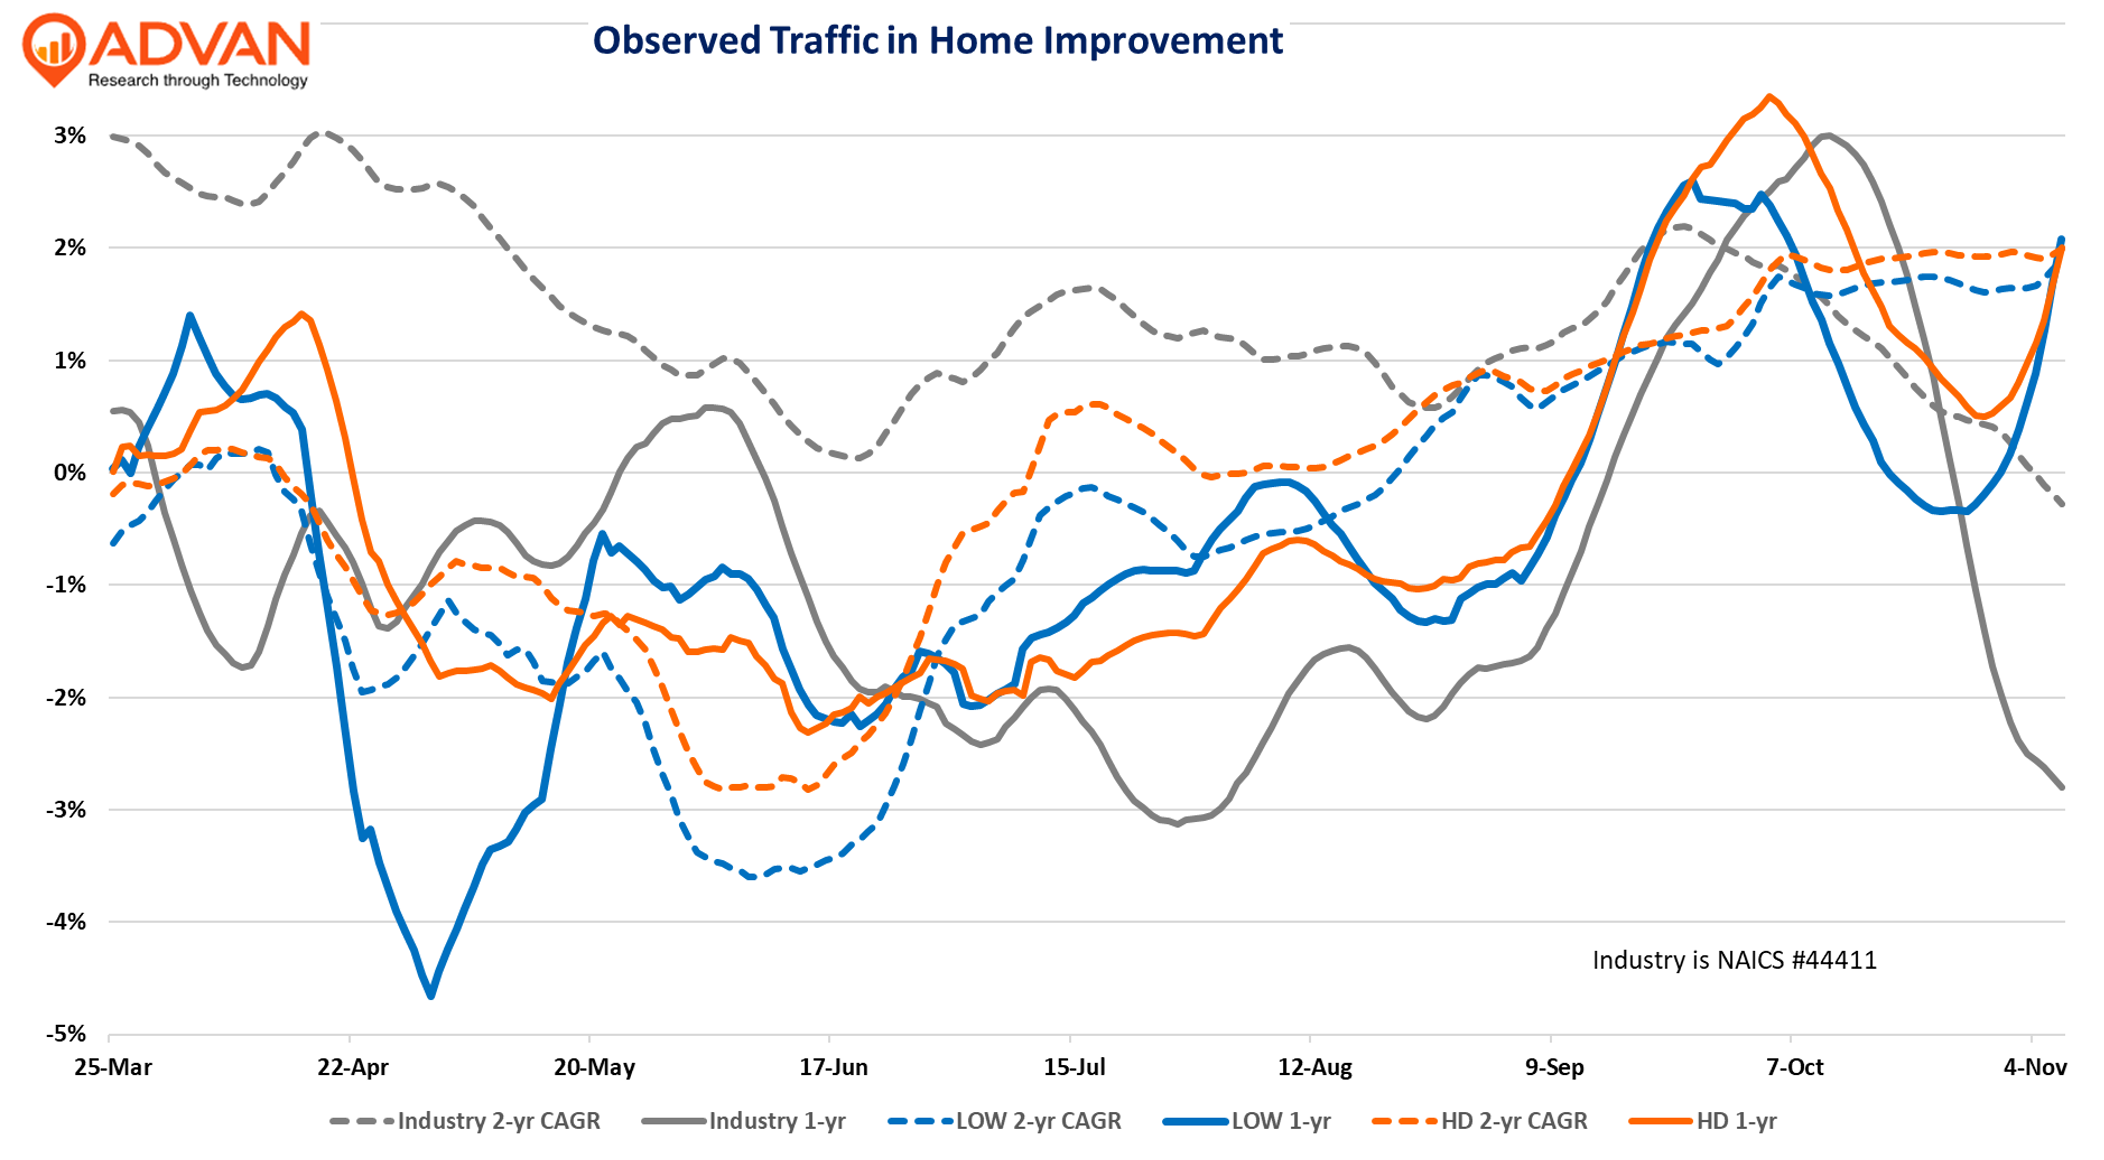
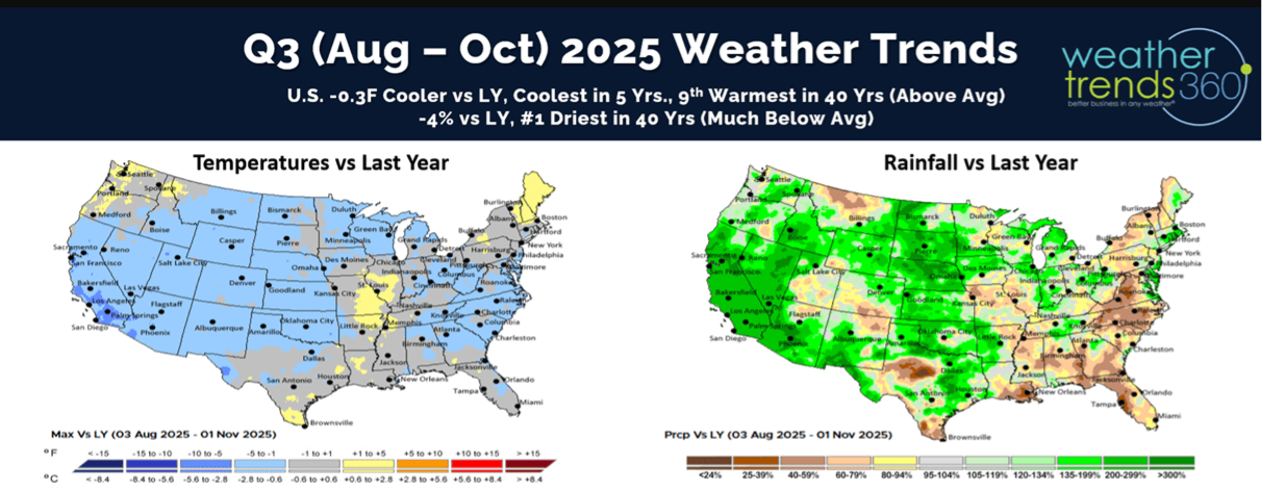
Observed traffic (per Advan) for the industry (NAICS # 44411, or home improvement centers) and HD/LOW has strengthened for the August – October period vs. the prior three months on a 1-year basis, but that’s the impact of Hurricane Helene. For HD / LOW, trends have strengthened on a 2-yr basis, but for the industry, it has softened modestly. Weather may have created a modest headwind to home improvement projects in the West. Home Depot is more exposed to the West.
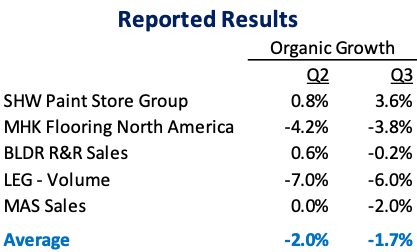
We next looked at our credit card data for the two; importantly, this data is more applicable to Lowe’s given that roughly 75% of the business in DIY and largely POS transactions. By contrast, Home Depot is majority commercial, which is typically a billed business; the POS is not the store’s registers, thus this large part of the business is missing from credit card data. Not unexpectedly, transaction data for Lowe’s is softer QoQ due to the hurricane comp; August was up; September / October are down. However, on a two-year basis – traffic and spend meaningfully improved QoQ. Additionally, average check also strengthened, implying more big-ticket spend (appliances, etc) and some recovery in larger projects. For HD, its DIY business, which was less impacted by Helene, was similar QoQ, both on a 1- and 2-year basis; its West exposure likely hinders both. Depot’s average ticket also slightly improved. If the pace of demand for R&R was quickening, Home Depot and Lowe’s would be increasing their in-stocks and inventory, and that would show up in better sales for the building material suppliers. The table below shows calendar Q3 organic growth for five leading suppliers, which improved slightly QoQ, but “slightly” is the operative word. And so, for home improvement, the trend is improving, but there’s been no step-change improvement and it has not been “egalitarian” – a word that we will come to shortly.
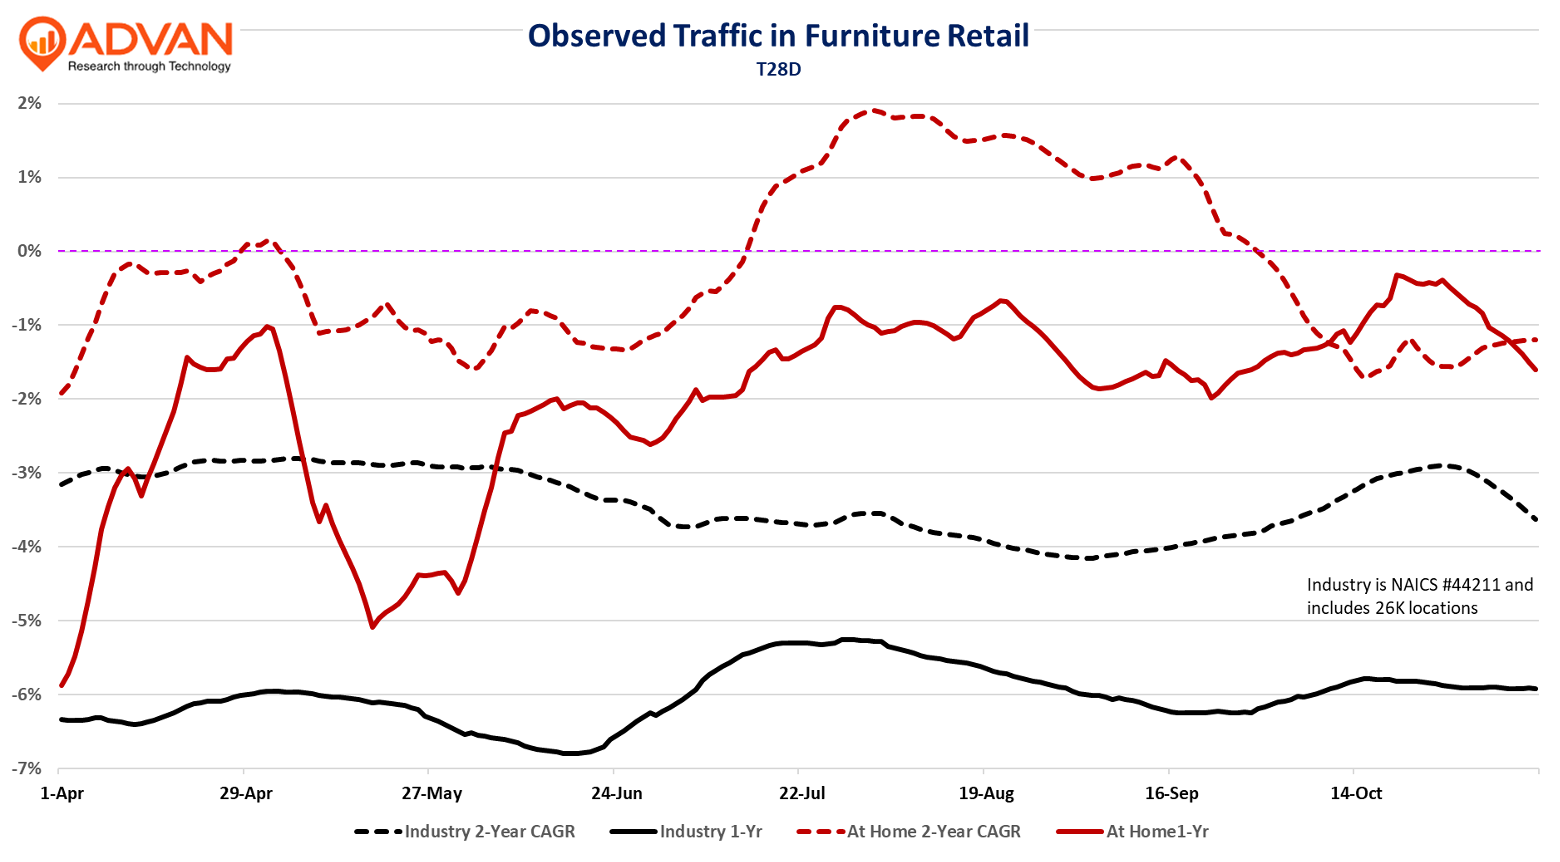
Observed activity that these suppliers’ facilities also improved on a 1- and 2-year basis, as we show in the chart below.

‘* Mortgage News Daily.