 LOGIN
LOGIN

- O’Reilly Auto reported sales trends largely consistent with Q3 trends. Its market share capture in Commercial was again very strong.
- The DIY side of the business is still soft, reflecting that consumer. That said, vehicles need to be repaired when they break down, and so the volume decline in DIY is reasonably benign.
- Competition appears rational, given O’Reilly’s strong gross margin performance and despite O’Reilly moving into new East Coast markets; they win durable market share by out-serving the competition.
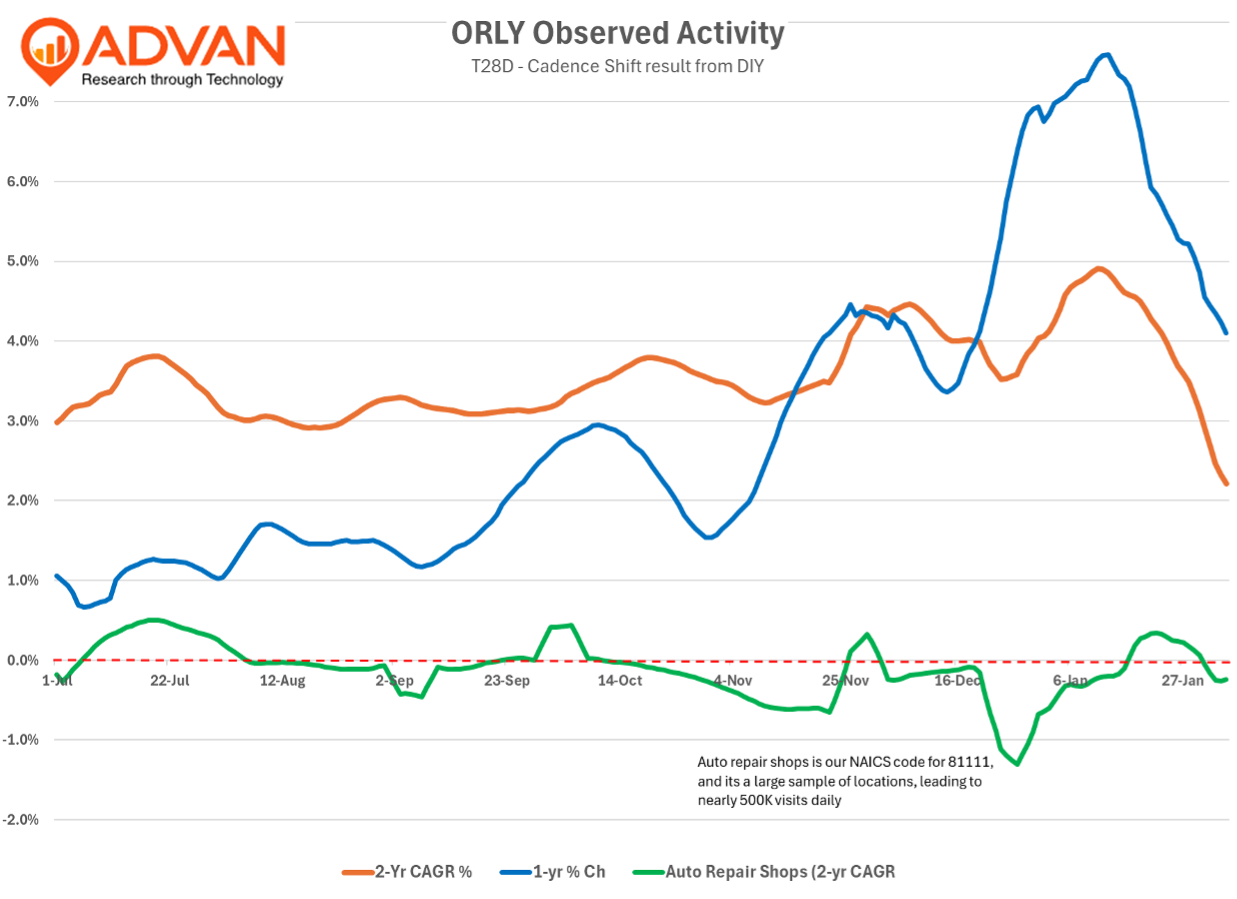
In terms of observed traffic* shown in the chart above, the 2-yr CAGR improved in December as Beckham described. The 1-yr trend showed a sharper improvement in December, but that’s primarily the comparison. For the quarter, reported comp-sales of +5.6% can be disaggregated into DIY comp-sales of +LSD with comp-ticket / -transactions +MSD / -LSD and commercial comp-sales of +10% with comp-ticket / -transactions +MSD / +MSD. (The business mix is 50 / 50). Advan observed traffic** traffic was +1.9% on a per-store adjusted basis, which captures both parts of the business. Inflation is driving the comp-ticket with same-SKU inflation at +6%. The stability of the commercial side can also be seen in the green line– observed traffic to the auto repair shop industry was largely stable*** on a 2-yr CAGR basis. The difference between O’Reilly’s commercial comp-transactions and repair shop traffic demonstrates meaningful market share capture by O’Reilly. The gains came from earning the business via excellent service, i.e. part availability and speed of delivery (vs. borrowed share that comes from short-term discounting). For the quarter, gross margin expanded by +49bps, above management’s guidance and despite the SKU inflation.
On 2026 and the commercial business, Beckham said, “We believe professional ticket counts will continue to be strong and will reflect incremental market share gains on this side of our business. Given our history of performance in growing our share in the professional business, our 2026 expectations anticipate some moderation in ticket growth as we compare against the high bar we have set. However, we have been extremely pleased with our team’s ability to comp the comp and stack continued professional transaction growth year after year, and anticipate 2026 will be no different.” To put a further point on the plans to capture share, President Brent Kirby said “For 2026, we expect per-store inventory to increase approximately 5%, comprised of investments in hub store inventories and targeted additions in store assortments. We continue to prioritize incremental inventory enhancements to capitalize on the opportunities that we see to accelerate our growth momentum and are pleased with the productivity of these investments.”
Beckham went on to say, “We have established a target of 225 to 235 net new store openings for 2026, an increase of approximately 25 stores over our growth in 2025. This new store target contemplates a step-up in U.S. store openings as well as a similar growth in Mexico to the 25 stores we added in that market last year. The increase in new store openings is motivated by our continued strong new store performance and the confidence we have in our ability to grow strong store teams and effectively execute our business model across our North American footprint [and up the East Coast].”
In our prior notes, we’ve highlighted O’Reilly’s intention to enter the Northeast. Over the past six months, O’Reilly added 10 new locations on the East Coast, above Georgia, and 17 new locations in Texas (see our Texas note here ). On the expansion Beckham said, “I always like to talk about the fact that, depending on where you draw the line there in the upper Mid-Atlantic, between Virginia and getting all the way through to New York City, you can almost come up with 1/3 of the population of the U.S. and all the vehicles to go along with it, all the market share to go along with it, though you obviously have a lot of tough competitors, large and small. But we look at really the way that we’re going to store that market, really no different… Our real estate teams are getting after that market, not only from a greenfield perspective, but also from a potential acquisition perspective. You’ve heard us talk about the Salvo acquisition of those 7 stores in the Baltimore, Maryland market. And really the whole key to that distribution center, besides the 5 night-a-week replenishment that we can service out a couple of hundred miles, is that model where have well over 150,000 SKUs, once you build that DC out once you build out the store network, that will service not only overnight, but will service that Greater Washington, D.C. market basically every hour on the hour in that greater metro area, which provides just an unbelievable advantage over most every competitor we have, if not all of them. And then we’ll backfill that with our hub-and-spoke model no different than we have in any other parts of the country. Knowing there’s a lot of traffic, a lot of cars in that market. We’re going to make sure that all those runs from that city counter out of that DC, as well as any hub stores, we’re going to make sure that it’s absolutely appropriate for that market share that we know we can go get… When I think about the ability that our team has given us, from Brent to the entire supply chain team, as we’ve opened these DCs, we’ve opened up capacity not just in 1 or 2 DCs. For example, in our network, we don’t just have capacity, now that we’ve opened Virginia, in Greensboro and outside Akron, Ohio, out there in Twinsburg, we actually, when you lever those DCs, you end up levering the next layer South and East and back West. And so that enables us to have backfill markets the same in a lot of our core, more mature markets.” See our last write-up on category trends here . ‘* Credit card (AltData) data largely doesn’t capture the commercial business because it’s a billed business. ** Adjusting for NSP of 60%. Others reported a +7.6% increase on a similar basis. ‘*** The trend was -90bps slower, but that is too precise to be meaningful. Advan’s measurement of NAICS 81111 is a large data set and capturing around repairs / servicing per day (assuming 2 visits per service).