 LOGIN
LOGIN
O’Reilly once again outperformed the competition and grew meaningful market share, especially in commercial (the DIFM business). Overall comp-sales increased +5.6% in an industry that grew around +1.0% (CB MRTS ) and ahead of NAPA (+2.2%). O’Reilly’s 2- and 3-year comp CAGRs, and new store productivity all strengthened. Commercial comp-sales were around +10.3%, whereas DIY lagged at +1.2%. The more sluggish DIY figure likely reflects the economic and societal pressures facing the non-affluent . A higher rate of SG&A expense growth and inventory investments demonstrate that O’Reilly is gunning for commercial market share by improving in-stock availability and delivery speeds. (Watch Advance’s commercial comp.) The disclosures also suggest more hours and earnings for employees; those make for happy employees, and happy employees stick around and give more cheerful (and faster / accurate) service to customers. Rinse and repeat!
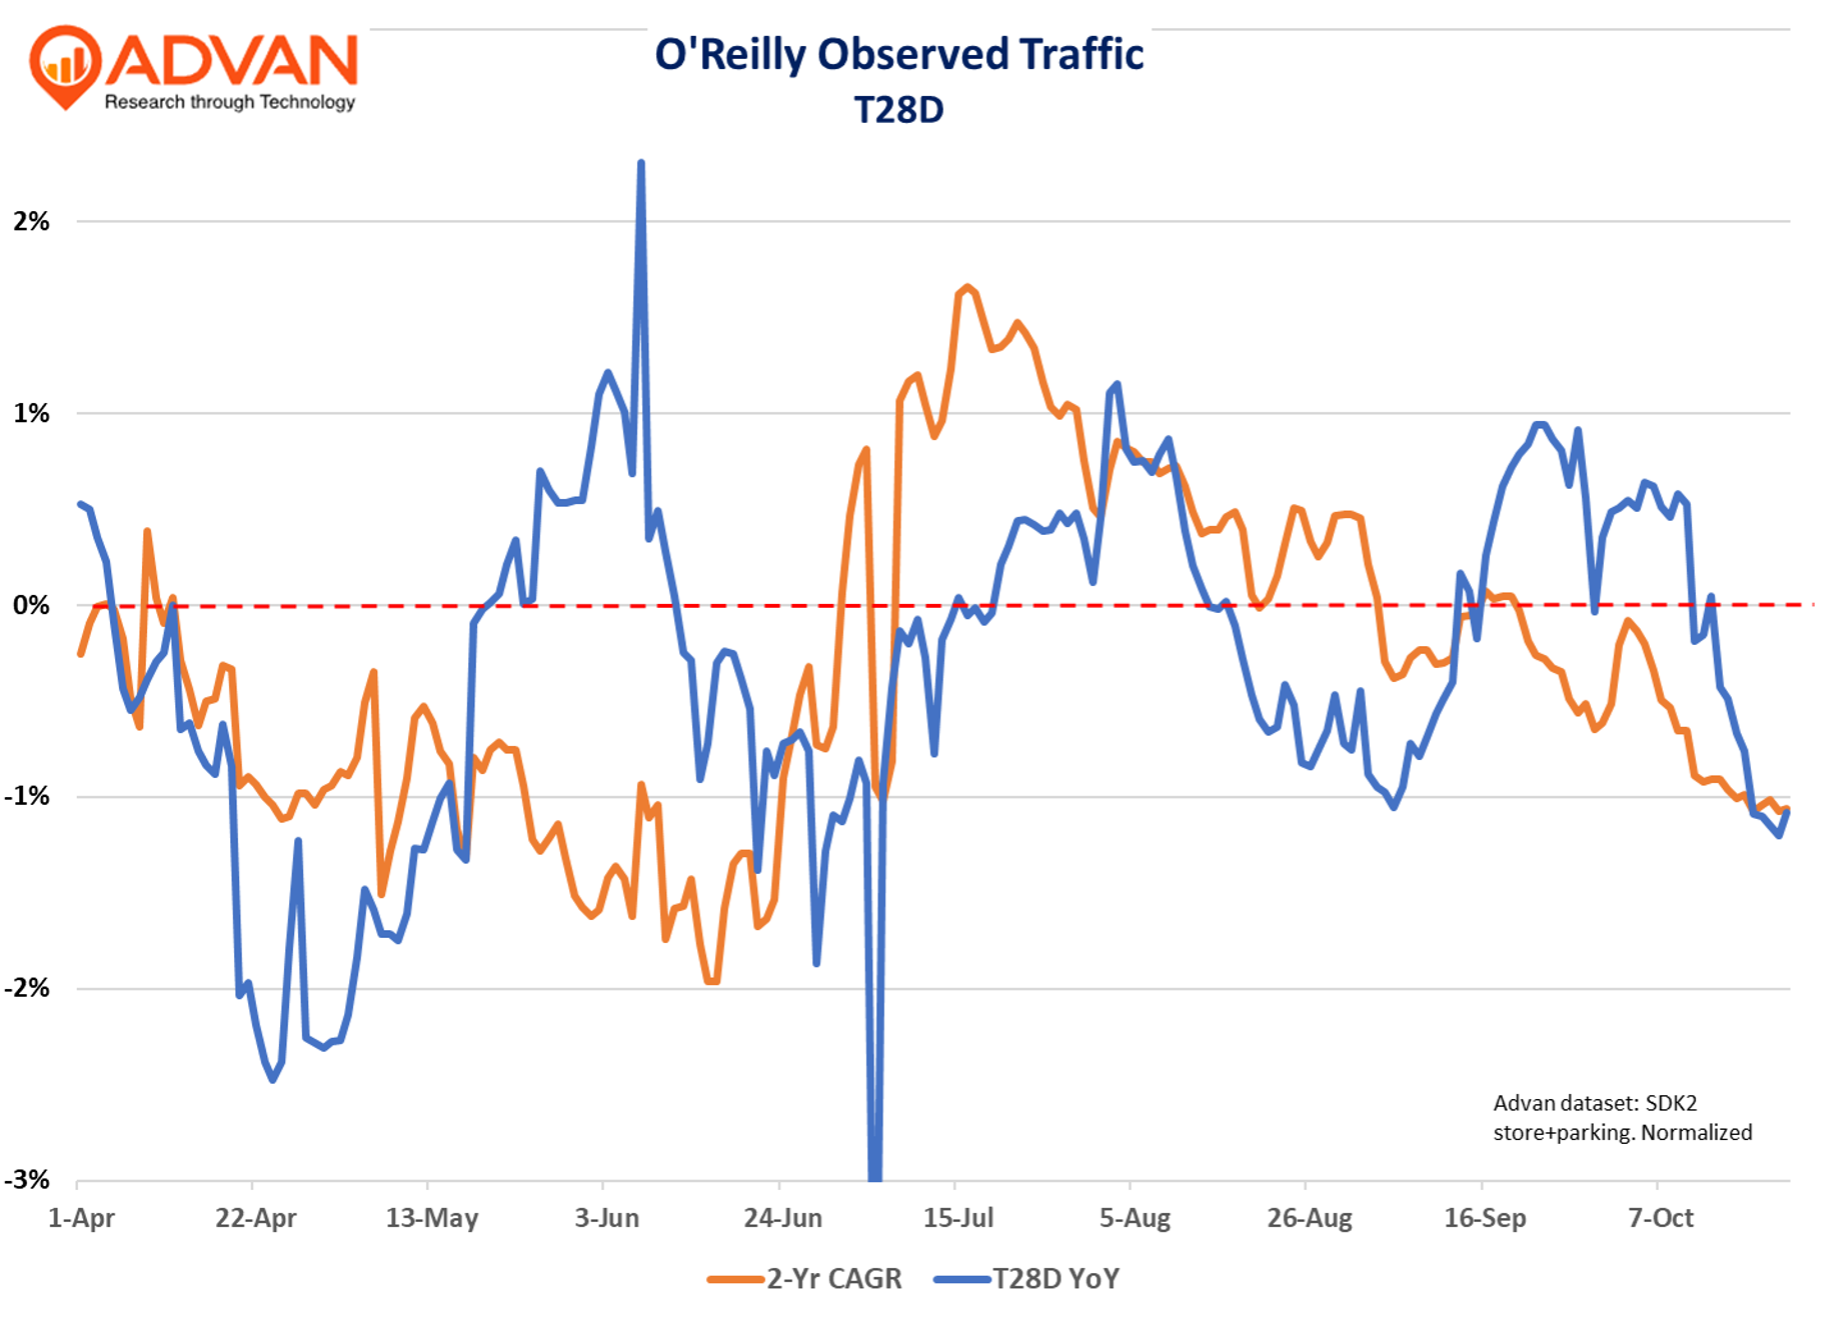
Overall observed traffic (Advan) accelerated +60bps, vs. the reported comp-sales’ +160bps. The faster +160bps was driven by more inflation (+250bps QoQ) and acceleration in commercial comp-transactions, partially offset by a deterioration in DIY comp-transactions. Per the chart below, the strong move up in September on the 1-year figure is disruption last year from the significant hurricane; by contrast, June ’25 suffered disruptive weather. Therefore, excluding environmental anomalies, we judge the traffic result to be only modestly better than Q2’s result.
Industry-wide traffic is down due to the weak DIY business, which is half of industry sales and more than half of profits. O’Reilly’s DIY comp-sales slowed by -40bps QoQ, despite increased inflation. As such, traffic was worse. If we assume inflation added an incremental +250bps QoQ to the DIY comp, that implies comp traffic deteriorated by -300bps. Commercial comp-sales accelerated +310bps QoQ, driven by stronger comp-transactions and inflation.
CEO Brad Beckman said, “Our Professional business continues to be the more significant driver of our sales results with an increase in comparable store sales of just over 10%. We continue to be pleased with the strength in our Pro ticket count growth, which was the primary driver of our professional comp increase and the biggest contributor to our outperformance relative to our expectations. We also saw increased benefit in the quarter from average ticket on both sides of our business that I will detail in a minute. We remain confident that the professional sales growth our teams are delivering is the result of share gains and as we continue to be the supplier of choice for our professional customers. Our share gains have been broad-based with strong contributions from all of our market areas. The strength of our professional business is anchored in the valuable relationship we have developed with our customers who value the end-to-end partnership our team is able to provide to their business through service, availability and business tools that help them be a service provider of choice to their customers.
We were also pleased to deliver DIY comparable store sales growth with this side of our business finishing the quarter with a low single-digit comp, driven by average ticket benefits, partially offset by pressure to ticket counts. Our DIY business was in line with our expectations in July after having experienced pressure in June as we exited the second quarter**. We began to encounter modest pressure to DIY transaction counts midway through the third quarter** (aligned with what we show in observed traffic), which we believe reflects some degree of initial short-term reaction by DIY consumers in response to rising price levels… On a category basis, the pressure to our DIY business as we move through the quarter was primarily felt in some categories where we could be seeing some deferral in larger ticket jobs. However, we continue to see strength broadly in other DIY maintenance categories, including oil, filters and fluids that have continued the outperformance we have seen throughout the year. We want to emphasize that we are still in the early stages of the consumer response to the ramp-up in price levels. It can be difficult to parse too finely the initial response from our DIY customers, but the pressure we have seen thus far is modest and in line with consumer reactions to economic shocks we have seen in the past.”
On expansion, executive Brent Kirby said, “We are pleased to announce our 2026 store opening target of 225 to 235 net new stores. Just as our 2025 growth has been spread across 37 U.S. states, Puerto Rico, and Mexico, we anticipate growth in all of those markets as well as in Canada in 2026… Our tiered distribution network continues to help drive our stores competitive advantage in parts availability, and we are pleased to begin servicing stores out of our new Stafford, Virginia, distribution center in the fourth quarter of this year. I would like to express my gratitude to our distribution and supply chain teams for all their hard work that has gone into this state-of-the-art new greenfield distribution center in the Mid-Atlantic market. This distribution center will be an important stepping stone for us to begin adding store count within heavily populated and untapped markets for us in the Mid-Atlantic I-95 corridor.”
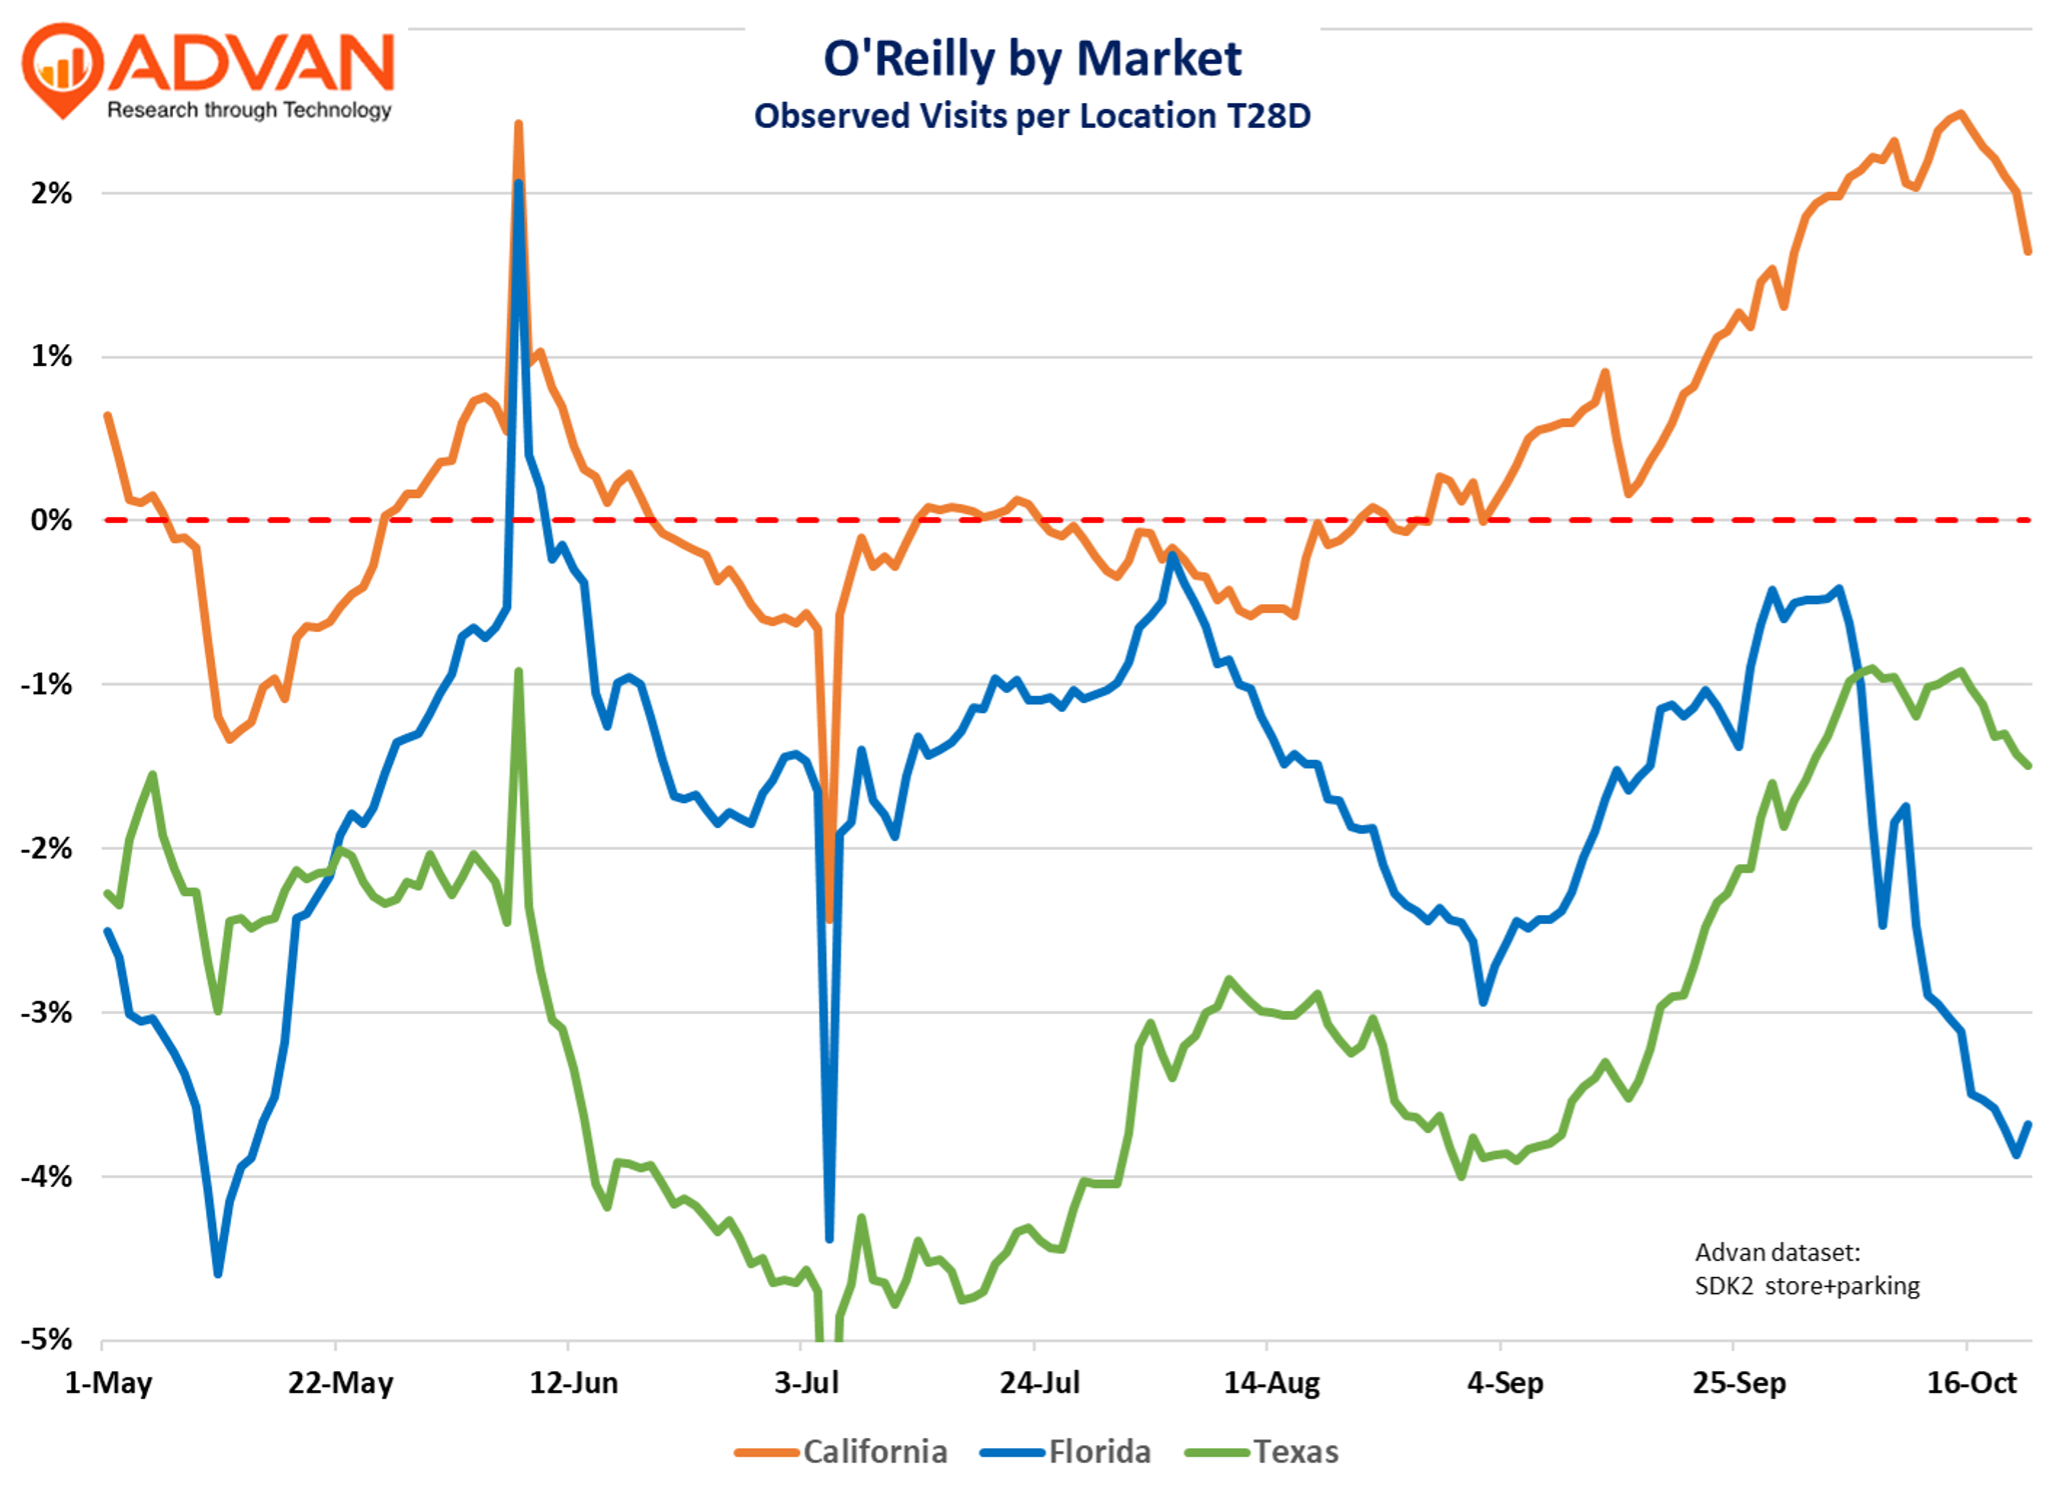
Our loyal readers will remember that we typically focus on three markets where the competitive dynamics are especially dear for O’Reilly – Texas, California, and Florida. There is a high degree of expansion in each market, which results in a denominator impact on the growth figures; as such, comp-traffic will be above the shown rates. Texas is O’Reilly’s largest market, and there is a higher rate of intentional cannibalization. Those new openings take the pressure off high-volume existing locations. In the years to come, the impacted locations will rebuild their sales volumes and drive comp increases at their location and for the entire company. Florida’s late September / early October deserves investigation (stay tuned).