 LOGIN
LOGIN")

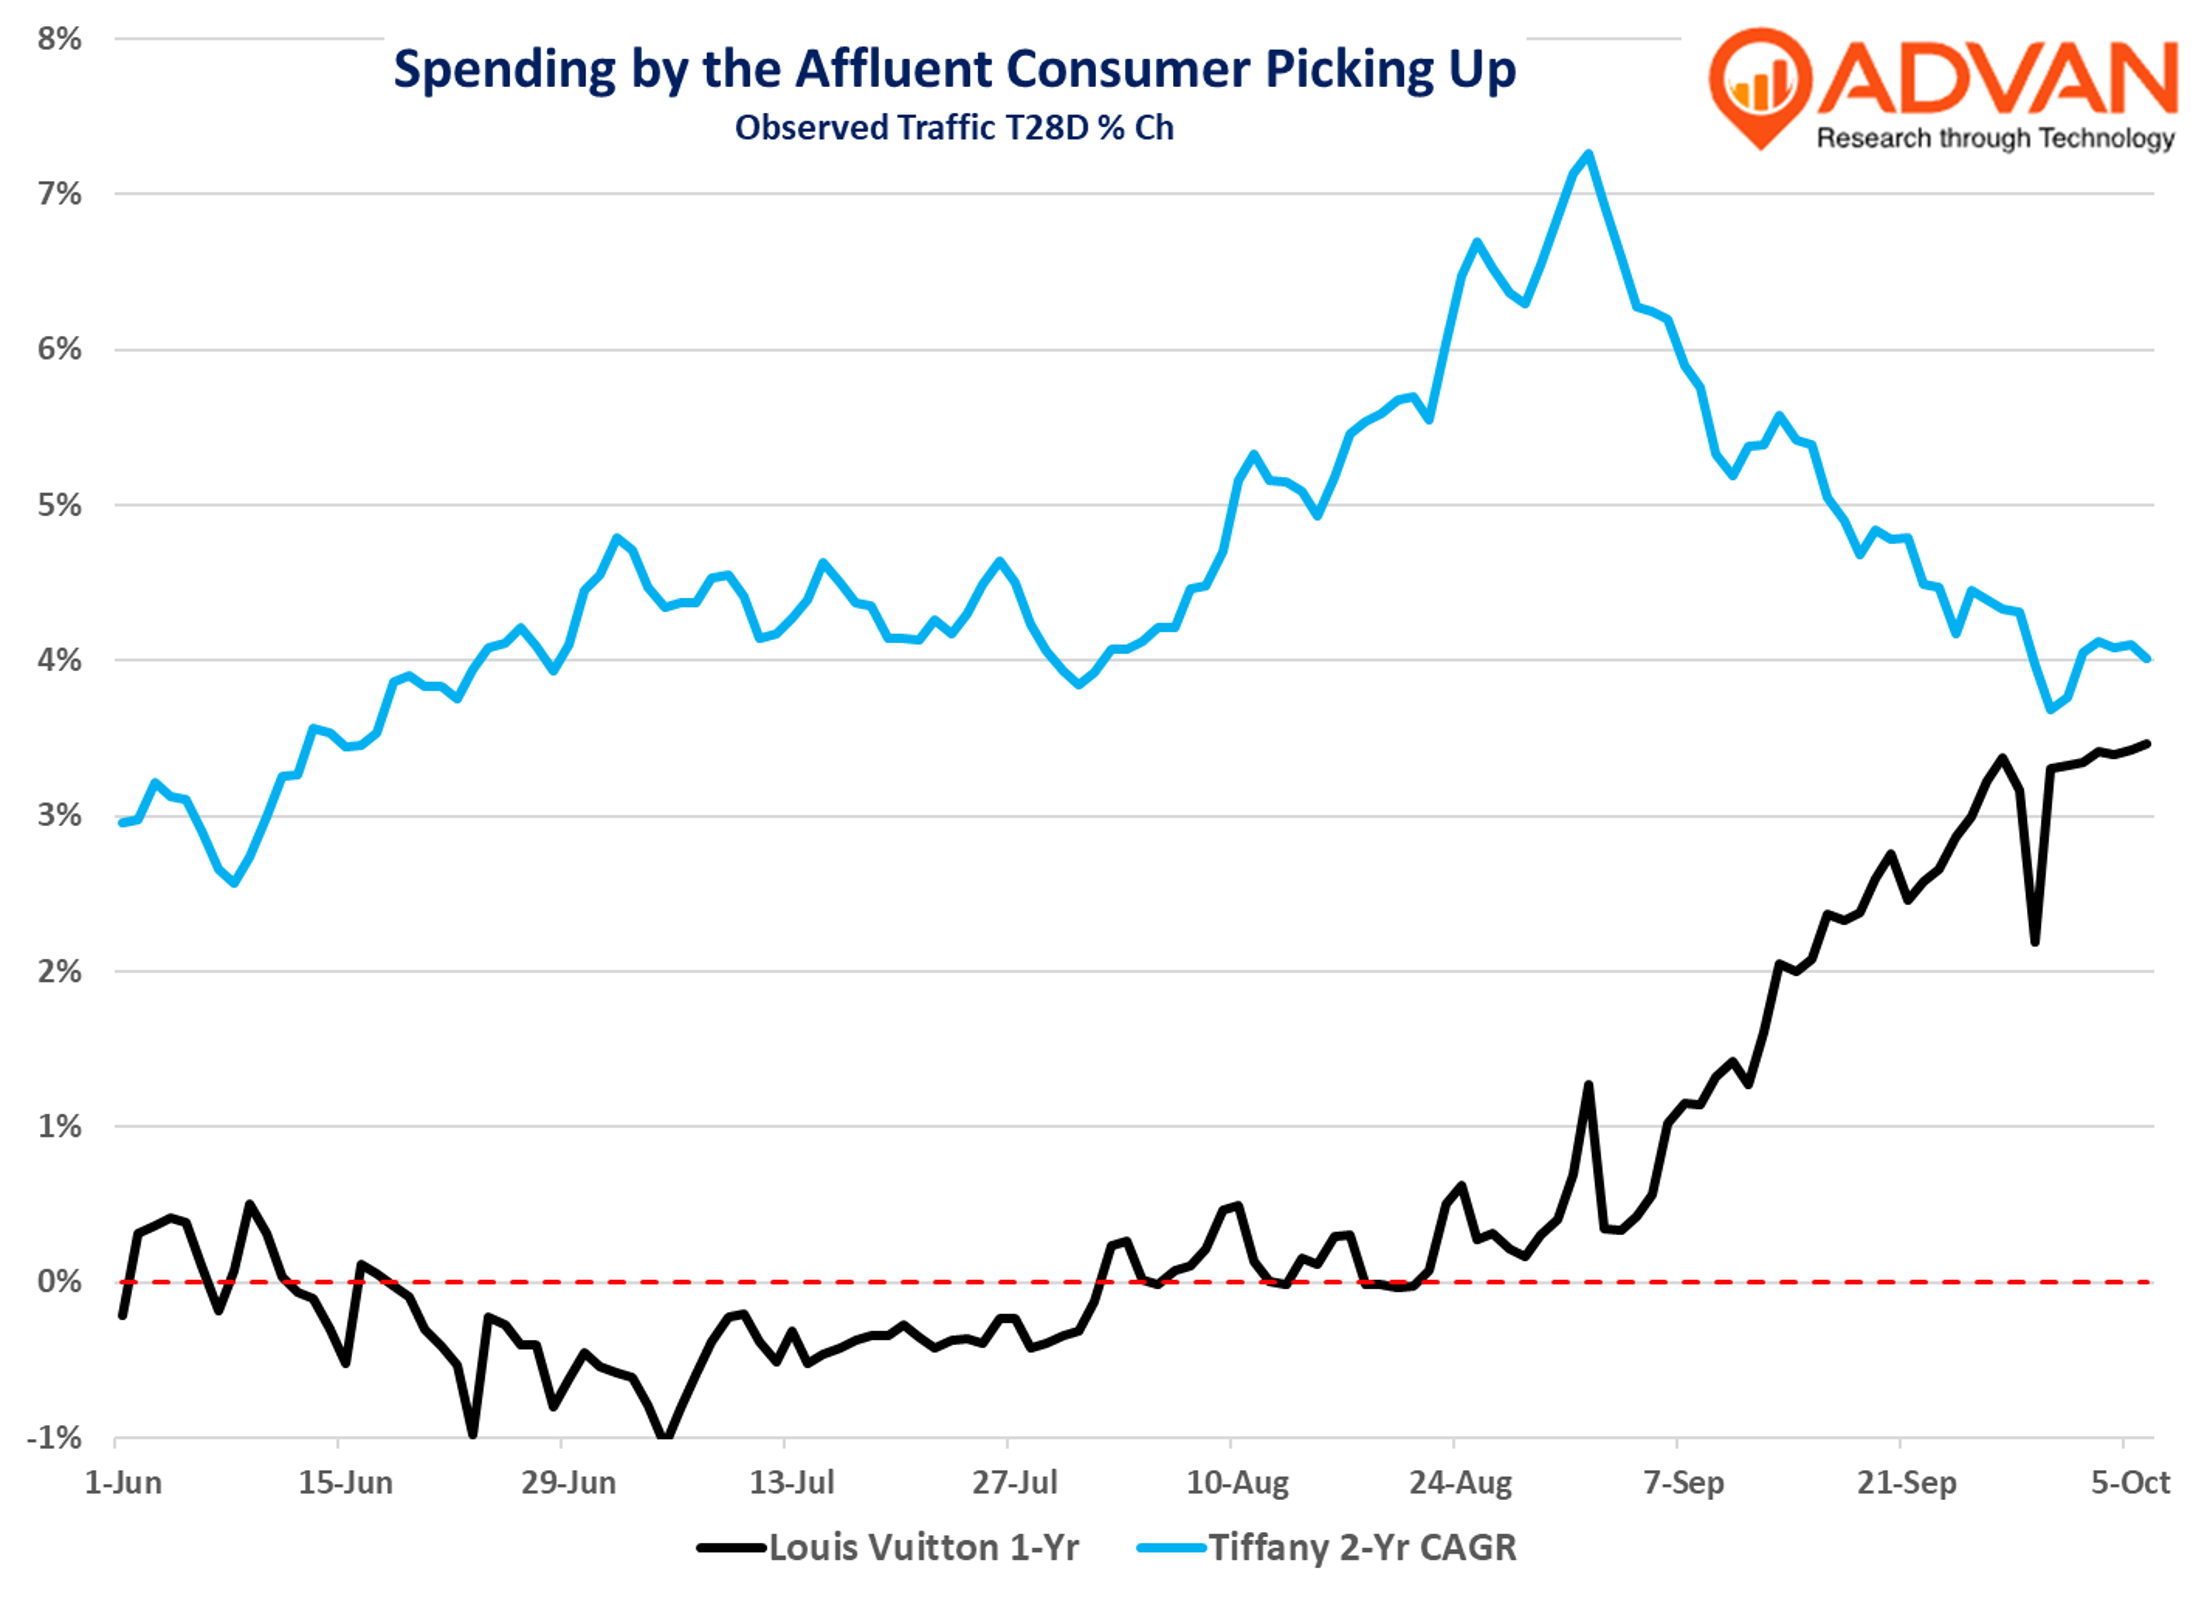
The Census Bureau was to release its report of September retail sales on October 16th. That is on pause now given the shutdown; as a result, folks will have to look at alternative data to understand how the US consumer is doing – a popular concern these days given the weakish new hiring and net job growth. With that, we are pleased to report that we believe retail spending (as defined by the Census’ report ) during September accelerated from August’s healthy pace, with the incremental driver being stronger spending by affluent households and continued improvement in housing-related demand.
We’ve looked at a number of indicators of higher-end consumer expenditure, and they all show a similar pattern of acceleration. We’ve chosen to show traffic to Louis Vuitton locations as it’s a bellwether for luxury. Breathern Tiffany also shows a pick up until September, when it lapped a large campaign in 2023. Why the pick up? We believe it’s due to: (1) less policy volatility than in the 1H, and (2) the very strong equity markets – with the wealth effect charging up the upward right arm of our K-shapped economy.
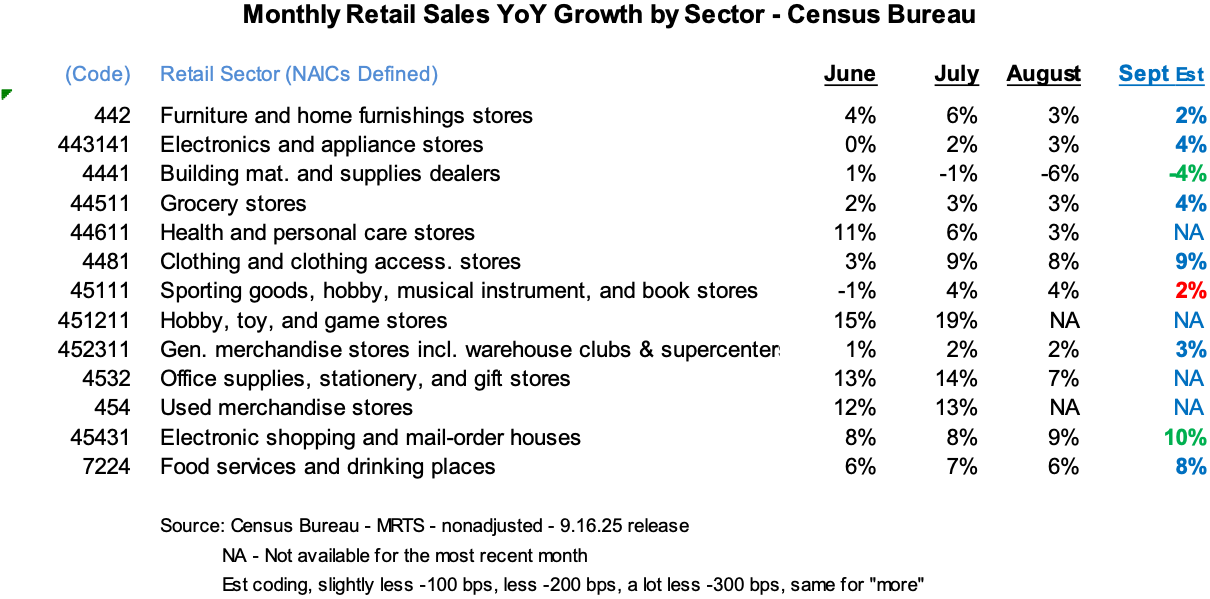
Category call-outs are:
- Furniture & home furnishing stores (NAICS #442) – slightly less MoM. HomeGoods outperformed, as is typical; F’QTD traffic for the brand is only -40bps less QoQ, i.e. within the range of rounding / estimate error.
- Electronics & appliance stores (NAICS #443141) – appliance stores were +150bps strong MoM, which we suspect provides further evidence that housing-related retail has “put the floor in” on the bottom of the cyclical drawdown. See our piece on Lowe’s and Home Depot. Electronics stores are going to be better MoM due to the Apple product releases; see our story here.
- Building materials & garden supplies dealers (NAICS #4441). Speaking of the leading home improvement retailers, Lowe’s and Home Depot, traffic improved significantly MoM (+200bps). Tractor Supply’s traffic growth was slightly less MoM, but for CQ3, its traffic strengthened by +70 bps QoQ. Recall, we suspect that Census is having measurement issues with NAICS #4441 as the statistics are not aligning with the reported results from Home Depot and Lowe’s.
- Grocery stores (NAICS #44511) – traffic improved slightly MoM, which we take to be more share-of-stomach gained from fast food (i.e. limited service NAICS-7225). Sprouts’ traffic increase was similar to August’s and the quarter’s increase was only -80bps less QoQ, i.e. within the range of rounding / estimate error**. Grocery Outlet**’s traffic pattern was similar, but QoQ traffic improved slightly, but within the range of error, etc.
- Clothing & clothing accessories stores (NAICS #4481) improved slightly MoM, however, like with NAICS #4441, we suspect that Census is having measurement issues with #4481. Traffic is up slightly for the industry, but we don’t think increases in basket size and conversion rate are elevating spending to the high-single-digit range, per common sense and company commentary at Goldman and elsewhere. American Eagle is still seeing a traffic lift, helped by Sydney Sweeney and Travis Kelce.
- Sporting goods traffic remains very soft, which is more macro-related, with the less affluent under compounding economic pressures. We heard about that last week from Nike, where its Classics business (Air Force 1, Air Jordan 1, and Dunk) declined -30% for its quarter. We also see transaction spending being more resilient than observed foot traffic.
- Hobby, toy, & game stores is an odd duck collection, but a hot category these days (trading cards, collectables, no** TEMU)**. We looked just at Five Below. As expected, traffic slowed (-250bps) from the very strong back-to-school period; however, the benefit from increases in conversion rate and basket size contributed a similar amount to September’s sales increase as was the case for its fiscal Q2 results. Our write-up here .
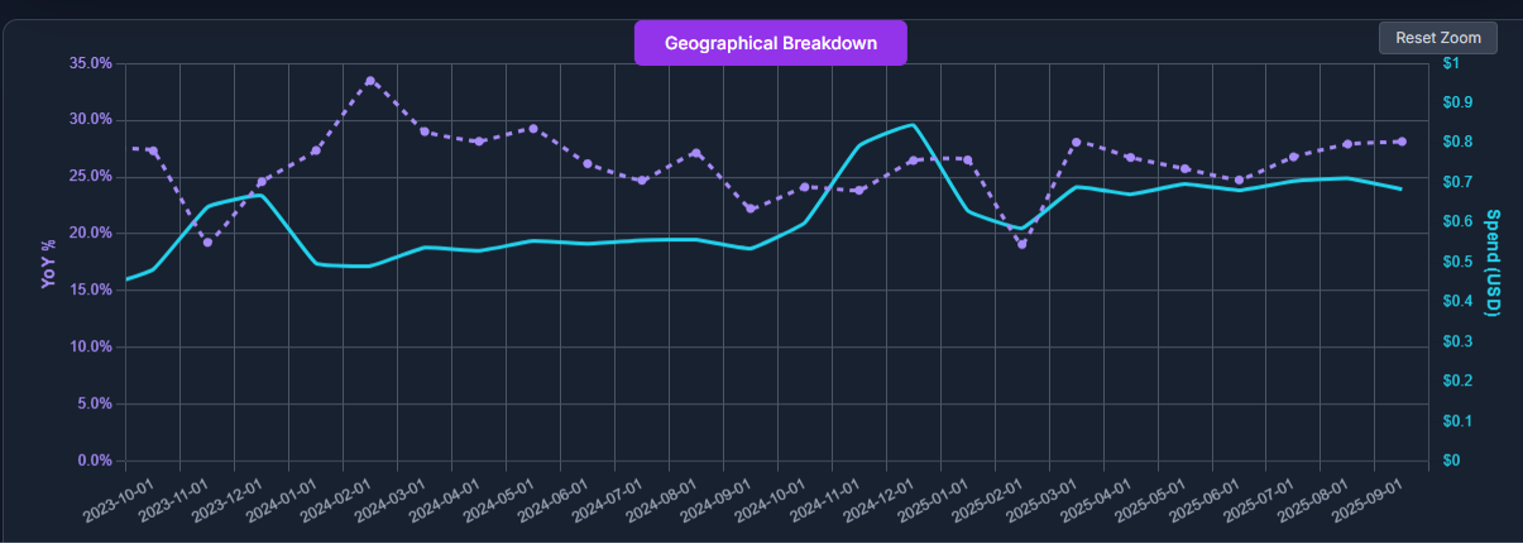
- General merchandise stores, including warehouse clubs & supercenters (NAICS #452311) improved slightly, which we expect, like with grocery, is share-of-stomach gains from fast food. We draw that conclusion from Walmart’s trends. Observed foot traffic improved MoM, but in-store spend slowed after a very strong back-to-school season; it remains at the May & June pace. Our new SpendView data , shows spending on Walmart.com (and its app) increasing +28% YoY, similar to August’s rate, and as shown below.
Spending on Walmart.com
- Costco’s traffic improved similarly to Walmart’s. Recently, we’ve been getting a lot of questions from business journalists about what we are observing for Target. We suspect that the curiosity, like earlier this year , stems from reports that traffic has worsened. Like that earlier period, while our observed traffic for Target is down (-2.4%), the trend has not worsened. However, spending per our SpendView™ and transaction data has softened materially. We suspect that the deterioration stems from a natural softening post the back-to-school season, but also ongoing competitive encroachment by Walmart, Costco, Sam’s, and Amazon, especially with Amazon’s recent offer of ”same-day perishable grocery delivery in over 1,000 cities and towns with plans to double that reach by year’s end.” We draw that conclusion because our SpendView™ data shows spending on Amazon accelerated +150bps to 14.1% YoY growth for September. We also see that in the quickening pace of activity at Amazon’s regional sortation centers, which accelerated by 11 percentage points in September; these are the facilities that stage the same-day perishable deliveries.
- Electronic shopping & mail-order houses (NAICS #45431) – see the above.
- Food service & drinking places (NAICS #7224) – is a frequent topic of ours given the divergent results between full-service and limited-service; you can find our story on Darden here , which encapsulates those thoughts. Limited-service is down more than full-service, as it functions as a home meal replacement, whereas full-service is largely a special occasion, and as such, share-of-stomach shifts back to at-home consumption is less of a factor. Importantly, there is a lot of concern / chatter that the trend in limited-service has meaningfully slowed in September, and Q3 from Q2. We disagree; the trend is down, but not materially worse than Q2’s, and the softer traffic is largely offset by more ticket growth. You can find our presentation on this here , which we delivered to UBS’ clients 10 days ago. The story has not changed since. As shown in the chart, the trend improved in July following June’s disruptive weather. August slowed again, but then traffic picked up in September. Part of September’s pick up was increased limited-time-offers and promotions, especially McDonald’s Extra Value Meals – our write-up here . Lastly, like with home improvement and clothing stores, we suspect that Census is having measurement issues with #7224