 LOGIN
LOGIN

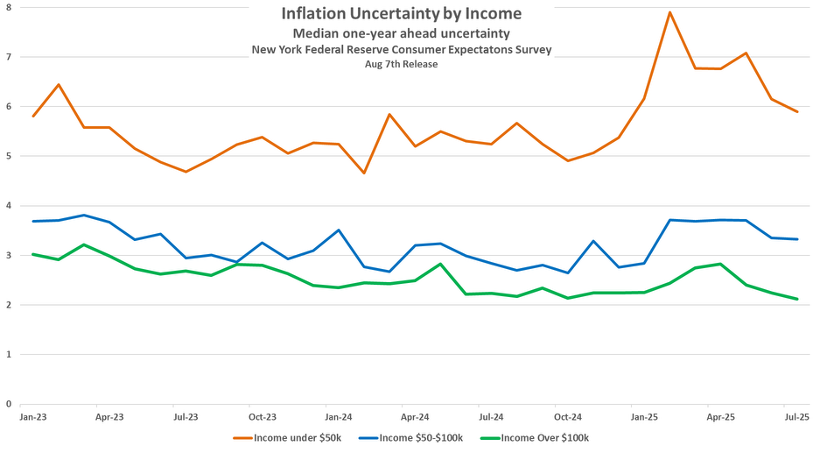
As previewed , July retail sales accelerated from June’s slower pace due to: first, a strong and early start to back-to-school, second, less disruptive weather, and third, a lessening of consumer uncertainty about inflation, as shown in the chart below. (The New York Fed’s survey also showed that expectations for the rate of inflation 1-year out also dropped for those with a household income above $100K). We suspect that the first was the largest factor, and as such, underlying retail sales should slow (ex. inflation) once again when we pass the back-to-school season. This is typical; the past two years have seen September at a -200bps slower rate than August (the General Merchandise, Apparel, Furniture, and Other Retail, or GAFO series).
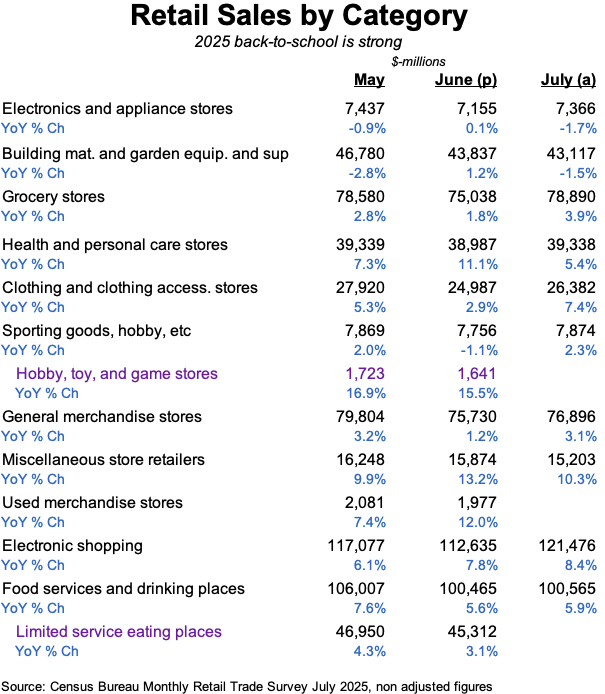
The table below is the Census Bureau’s retail sales report for July. We will comment on some categories here and others in the text that follows when we go into our back-to-school observations by brand. Electronics and appliance stores slowed from June’s improvement that was supported by the new Nintendo Switch. Building materials are sluggish due to housing and adverse weather. **Grocery stores **are picking up due to gaining more share-of-stomach from fast food, which is also shown in the slower trend for Limited service eating places. Health & personal care (or pharmacy) is up on strong sales of GLP-1s – Wegovy, Ozempic, and Zepbound. Electronic shopping is driven by Amazon; we remind readers that Amazon indicated a strong back-to-school trend when it reported Q2 earnings.
Advan’s observed visitation / transaction data shows Walmart’s July stronger than June, which itself was stronger than May’s; early August is up on July’s rate. Target’s trend in July is unfortunately less than June’s and observed visitation is down for each month of fiscal Q2. Dollar General has been very consistent month-to-month, neither acceleration, nor deceleration. By contrast, Five Below looks to have had a very strong July and early August. Per the table above, General merchandise stores had a stronger July. So within this category of retail, Walmart and Five Below appear to be the back-to-school standouts. (For all of these periods, we are using the retail calendar; for July, this is July 7th to August 3rd. Separately, we only observe store-level visits and transactions. E-commerce is another large contributor to the results of Target and Walmart.)
It has been our view that Five Below is benefiting this year from less Temu following the elimination of the de minimis exception. The benefit also holds for Dollar Tree, secondhand stores, and craft retailers. Check out the 12% growth for Used merchandise stores in the table. (Used, Hobby, and Limited service are missing July because that detail won’t be released until next month’s report.) Craft retailers because Etsy’s crafters purchase supplies from Hobby Lobby and Michaels, where traffic has grown healthily each of the past three months, and they have experienced exceptional growth in spend. See the very strong growth for **Hobby, toy, and games **which include craft retailers. Hobby Lobby and Michaels also have the market to themselves as Joann closed its remaining stores in May. As a reminder, Temu and Shein aggressively advertised and bought leads on TikTok, Instagram, YouTube, Google at such a “feverish” and un-economic level that brands such as Etsy, eBay, Revolve, e.l.f, etc. couldn’t afford to purchase the level of leads that their business had been built up on, leading to a growth reset. However, that time has passed and Etsy reported a +350bps QoQ improvement in seller sales volumes for Q2, and guided to ongoing improvement in Q3. CFO Lanny Baker shared, “The monthly [volume trends] strengthened over the course of the quarter, inflecting into positive year-over-year comparisons in May and June.”
Etsy CEO Josh Silverman said on the improved trajectory, “[W]e’re making progress leading into paid social, where we want to be where people are discovering and seeking inspiration in the first place. In places like Instagram and YouTube, Pinterest, TikTok are areas where we think we’ve been underpenetrated in the past (because Temu outbid them), and we are closing that gap, and we’re really encouraged by that… In particular, there were a few periods of time when some combination of Amazon, Temu and Shein pulled out of the Google auction that was a small tailwind, and consumer spend stabilized after what was a very volatile April, consumer spend stabilized in May and June, and that was helpful. What we’re particularly encouraged by is that these trends have largely sustained. And I think that’s why we have a guide for the third quarter that shows sustained continued progress.” Given less competition from Temu and Shein for ad impressions on Google, TikTok, etc., Etsy boosted marketing spend to 16% YoY growth in Q2, vs a decline last quarter.
In the off-price segment, after an unusually slow June, things picked up nicely in July and early August. We are still puzzled by June, and so that’s what we hope to learn about when results are reported in the next couple of weeks. Our hypothesis is that the month was hindered by less new merchandise flow and lower in-stocks due to transitory factors stemming from “tariff discombobulation,” with Ross Dress for Less most impacted. Supportive of this hypothesis is the decline in dwell time for June across all three companies. Less dwell time results in a lower conversion rate and fewer items in the basket (UPT).
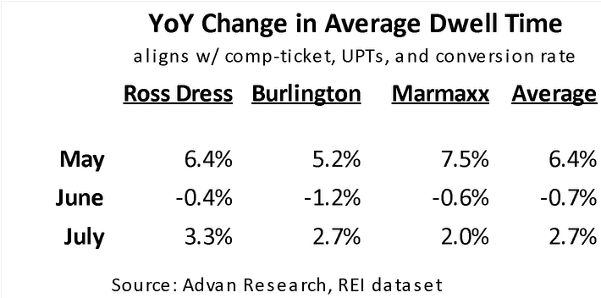
As to the improvement in spending in July, Burlington’s acceleration was the most striking; that may indicate building success by Burlington in putting “better and best” brands in front of its shoppers (which boosts comp-ticket and conversion rate), a strategy that also drove very strong fiscal Q4 results . Also as shown below, the MoM improvement in dwell time was the greatest at Burlington (+390 bps).
In department stores and specialty, Kohl’s trend meaningfully accelerated in July, with traffic improving by 200 bps and spending increasing mid-single-digits. Part of this has to be tariff pass-through, part of it may be less Shein. Dillard’s reported a +1% increase in comp-sales for fiscal Q2, a +200bps QoQ improvement. Its earnings release quotes CEO William T. Dillard, “We were happy to achieve a sales increase for the first time in a while and encouraged by strengthening sales trends in July.”
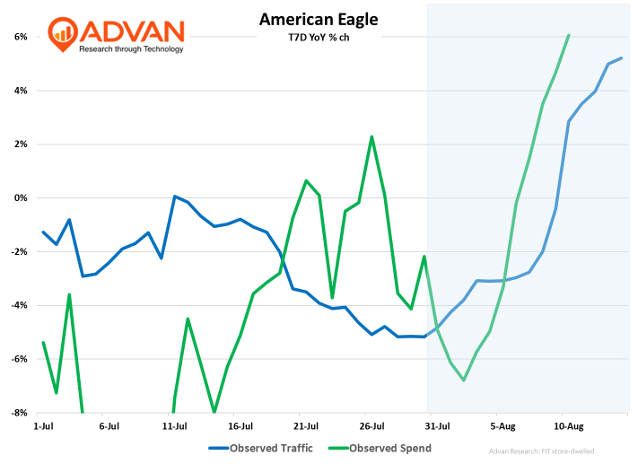
By contrast, there was no improvement in Old Navy’s traffic, which was down low-single-digits. There’s been a lot of interest in what we are observing at American Eagle from the Sydney Sweeney campaign. As shown, since the campaign “went viral” (July 31st), the traffic and spend trend have firmed up from the trend prior to the campaign drop on July 23rd. However, ahead of the campaign, American Eagle likely held back on marketing and promotional campaigns, which would have dampened that period’s trend. Additionally, we’d expect any “reaction” to be experienced more prominently on its website than foot traffic to stores, as that channel is more reflexive. Other data sets observe a 50%+ lift to site traffic after the 27th, thus affirming our suspicion on channel dynamics.
In sporting goods retail, observed traffic at Dick’s Sporting Goods and Academy remains soft; however, spending notably improved (+500bps) in July, which we suspect is the combination of strong back-to-school results and tariff pass-through, similar to what we observed at Kohl’s. This view is also supported by the acceleration in Sporting goods, hobby, etc as shown in the table above.