 LOGIN
LOGIN

- ROST and BURL both turned in much above-plan results (and expectations). However, the composition of the comp-sales increase was quite distinct between the two, with ROSS’ driven by an increase in comp-transactions and BURL’s driven by an increase in comp-ticket. Consumers’ time shopping ROST increased markedly, as did its conversion rate; whereas, consumers’ time shopping BURL declined, as did UPT.
- Off-price retail should really be called “treasure-hunt” retail. The more time consumers spend shopping the store, the more opportunity there is for adding more items in the basket (UPT). More items also implies happy shoppers; happy shoppers promote the brand to friends and family (and Instagram and TikTok).
- In 2025, off-price sales growth was the product of a secular driver (its treasure hunt appeal), a cyclical driver (consumers’ feeling budgetary pressures), and two idiosyncratic drivers – GLP-1s and tariffs.
- Excluding weather, 2026 has started strong for treasure-hunt retail.
Following TJX’s strong FQ4 results, Ross Stores Inc. (ROST) and Burlington (BURL) turned in much above-plan results (and expectations). However, the composition of the comp-sales increase was quite distinct between the two, with ROSS’ driven by an increase in comp-transactions and BURL’s driven by an increase in comp-ticket. Below we delve into each’s results; however, there are two broader takeaways from the group’s FQ4 results (call it the Big-3). The first, these brands are characterized as “off-price” retailers, and historically, they picked up cancelled orders or excess product from the traditional department store industry, in bulk, and then put the merchandise in their stores at a 25-40% discount to the listed department store price, thus the moniker “off-price.” However, given that the revenue (in apparel, etc.) has grown to be 33% larger than the entire department store industry, the Big-3’s business model and the consumer proposition have changed. What they offer is “treasure-hunt” and where they source goods is global and across channels, DTC brands, Amazon, etc, and including made-to-order from the manufacturers.
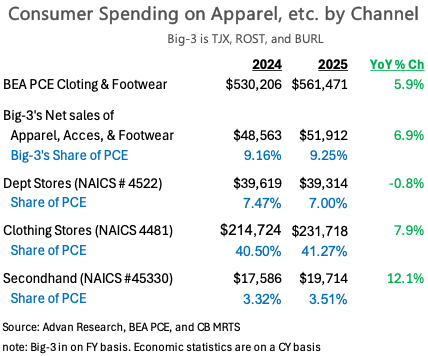
Treasure-hunt has exploded over the past decade, fueled by: (1) consumers needing lower prices to afford the items that they need, (2) treasure-hunt is “fun” giving a positive endorphin rush like winning in craps or blackjack, and (3) social media provides an outlet to celebrate “treasured wins.” (A kind of gamification of shopping.) The other proof point for the evolution is that if its consumer proposition was limited to undercutting department stores’ prices / value to winning share from that channel, Big-3’s growth would be far less. Given the amount of $-growth that the Big-3 are producing (+$3.3B in ’25), the growth needs to come from a much larger TAM and that’s what the table above dimensionalizes. Looked at in this fashion, the Big-3 has only a 9.3% share of clothing & footwear consumer expenditure. Other categories / brands that we consider to be treasure-hunt include club stores, secondhand stores, flea markets, and Ollie’s Bargain Outlet (and others), and all of these had a great 2025. (Ollie’s reports on Thursday and results should have improved on FQ3’s trend.)
The second major takeaway from earnings results and the table is that while the Big-3 did take share in 2025, it wasn’t a lot of share. Clothing store retailers (NAICS 4481) and secondhand retailers (NAICS 45330) took more share of clothing & footwear consumer expenditure than the Big-3. (Pre-pandemic, secondhand only grew at a roughly 3% rate, thus, there’s been a change in the consumer and economy.) Moreover, in 2025 the apparel category was in high growth as we are in an “apparel super-cycle” of consumer re-wardrobing fueled by the rapid uptake in GLP-1 drugs for weight loss. (The super-cycle should amplify in 2026 given increased payer coverage of GLP-1, the new pill format, price cuts, and more advertising – did you watch the Super Bowl advertisements?) In 2025, consumer spending on clothing increased by +6.4% and the increase was not due to tariff-pass-through; the price component actually fell YoY, putting the unit increase was above +6.5%. Lastly, tariffs caused a lot of disruption to both retailers and manufacturers in ’25; off-price retailers clean up in opportunistic buys during a period of high disruption. 2025 was a period of very high disruption. To conclude, the Big-3’s growth in ’25 was the product of a secular driver (its treasure hunt appeal), a cyclical driver (consumers’ feeling budgetary pressures), and two idiosyncratic drivers – GLP-1s and tariffs. Additionally, each of the Big-3 were on top of their game in ’25 and executed extremely well, especially ROST.
ROST reported a +9% comp-sales increase for FQ4, which was largely transaction-driven. **Observed traffic, transactions, and average ticket **increased +3% / +7% / +3% respectively (adjusted for the contribution from new stores). That transactions lead traffic indicates that the conversion rate improved, which is the mark of success by ROST’s merchants. The +3% increase in average ticket was the result of retail (AUR), more better and best product. Units per transaction (UPT) was “flatish.” One of new-ish CEO Jim Conroy’s initiatives is the contemporization of ROST advertising with more spending on Instagram and TikTok; that’s showing ongoing success with the increase in comp-traffic. One way to contextualize the growth in the business is by measuring the time shopping in the stores and we show that in the table below. Ross had the most success during CQ4 in driving growth or “treasure hunting. The business outperformance has continued into FQ1 with management guiding for another astounding comp-increase of +7-8% and February’s adjusted **observed traffic and transactions **increasing by +7% / +12%.
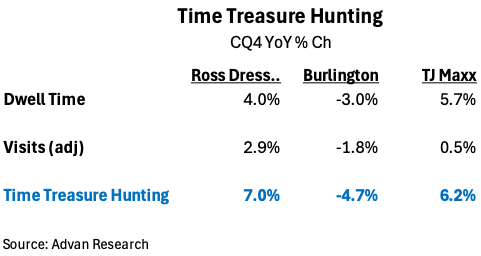
Burlington reported a +4% comp-sales increase for FQ4, which was largely ticket-driven. **Observed traffic, transactions, and average ticket **were -2% / +1% / +3.5% respectively (adjusted for the contribution from new stores). Transactions again led traffic, indicating that the conversion rate improved; adverse weather could also be at play. Given the footprint differences between ROST and BURL, weather would have been a much larger disruptor of BURL’s metrics. The +3.5% increase in average ticket was the result of more better and best brands (as was the case for ROST). CEO Michael O’Sullivan said, “When we analyze our sales by price point, we see that the highest comp growth rates are in the higher-priced buckets. In other words, despite the economic pressure she may be feeling, our customer is responding to the great values we are offering at these higher price points. These trends drove a mid-single-digit increase in our average unit retail [AUR] in the fourth quarter.” Thus, implying that UPT declined, and aligning with the observed decrease in dwell time. O’Sullivan, “As we hindsight the quarter, we can see that there were important categories where we could have done more business,” and again implying a decline in UPT and explaining the delta between observed average ticket and [AUR]. O’Sullivan, “Which businesses could have delivered more sales then… [G]ifting, home decor, housewares, bedding, toys, seasonal decor…” See our last write-up on industry trends here and here , and the last results from TJX.