 LOGIN
LOGIN
When the federal shutdown began on October 1st, most of the conversation focused on staffing shortages, flight reductions, and long lines. But looking at schedules and headlines doesn’t tell you how people actually moved through airports.
So we turned to Advan’s foot traffic data.
And because TSA publishes daily passenger screenings, we paired the two together to understand the shutdown from both ground truth and foot-traffic behavior.
The story that emerges is surprisingly clear and not always what you’d expect.
TSA and Advan Tell the Same National Story
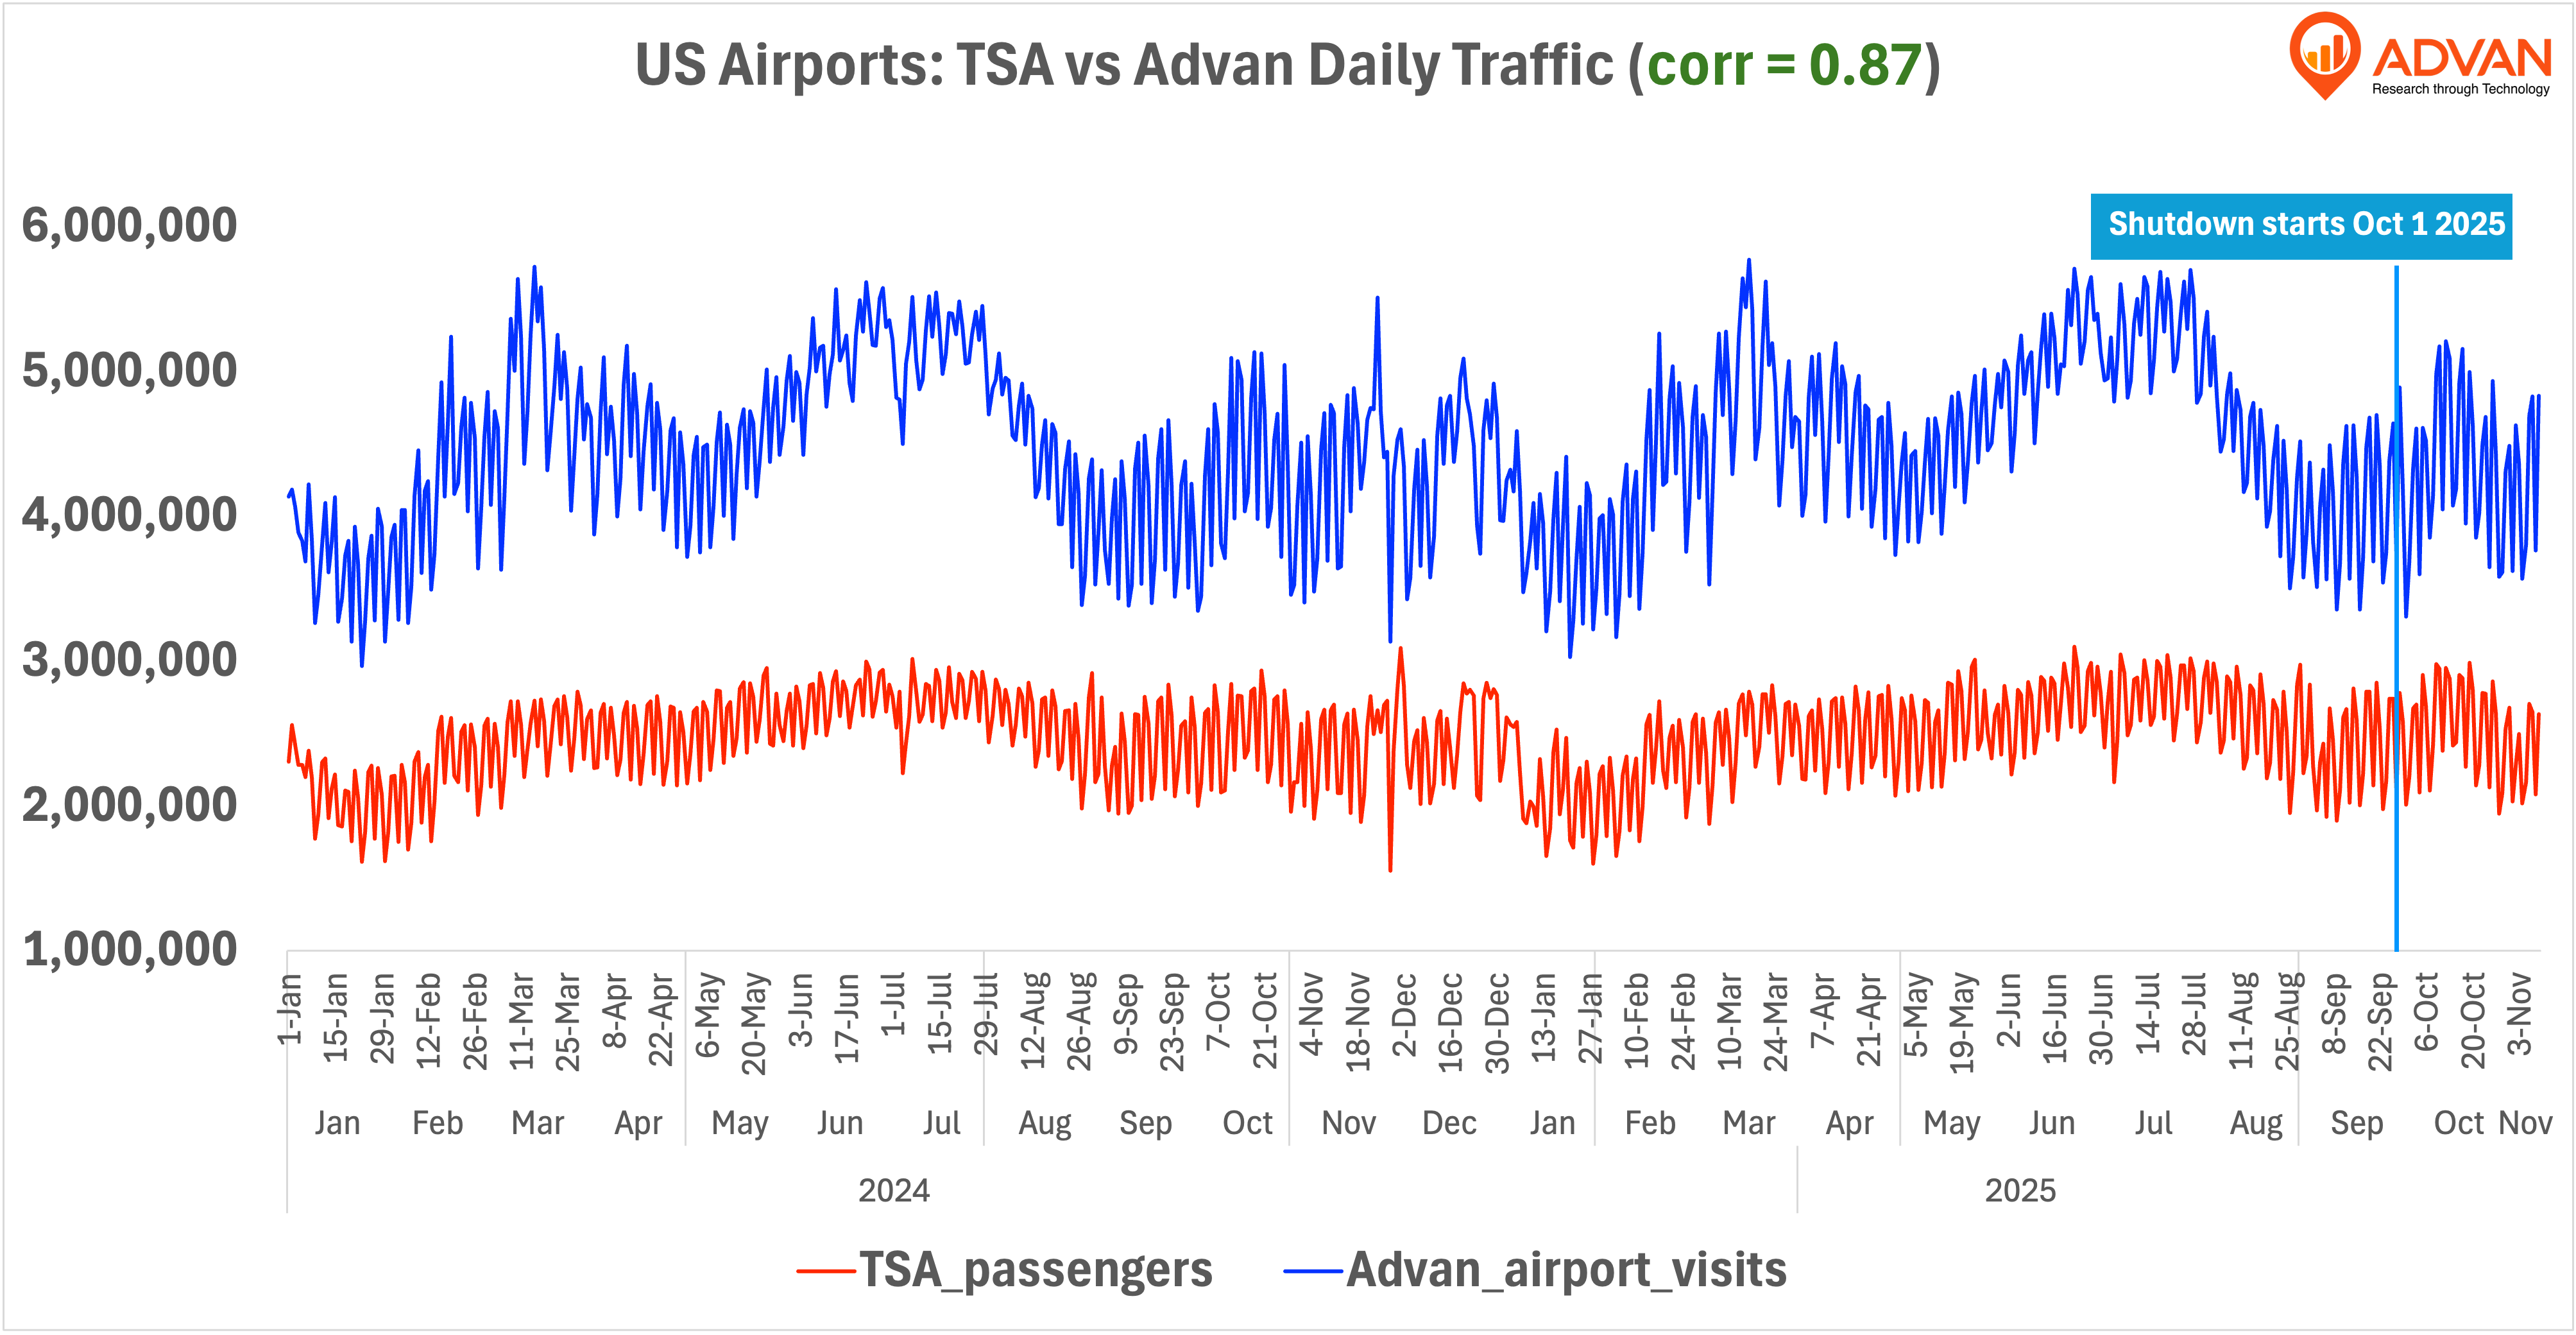
The above chart overlays daily TSA screening volumes with Advan’s estimated airport visits across all U.S. airports. The two lines move almost identically for nearly two years, with a correlation of 0.87.
That’s important, because it means:
- TSA gives us the baseline of real-world demand, and
- Advan lets us drill down into where and how that demand shows up inside airports.
Looking at the chart, both TSA and Advan show the same pattern:
- A soft September overall: TSA daily screening hit an average of 2.4M while Advan daily estimated visits averaged 4M for the same period.
- A rebound into late September
- And then a strong October, even as the shutdown takes effect on Oct 1
The big headline from this chart: Demand didn’t fall during the shutdown. The system stayed busy.
National Traffic Didn’t Collapse, It Climbed
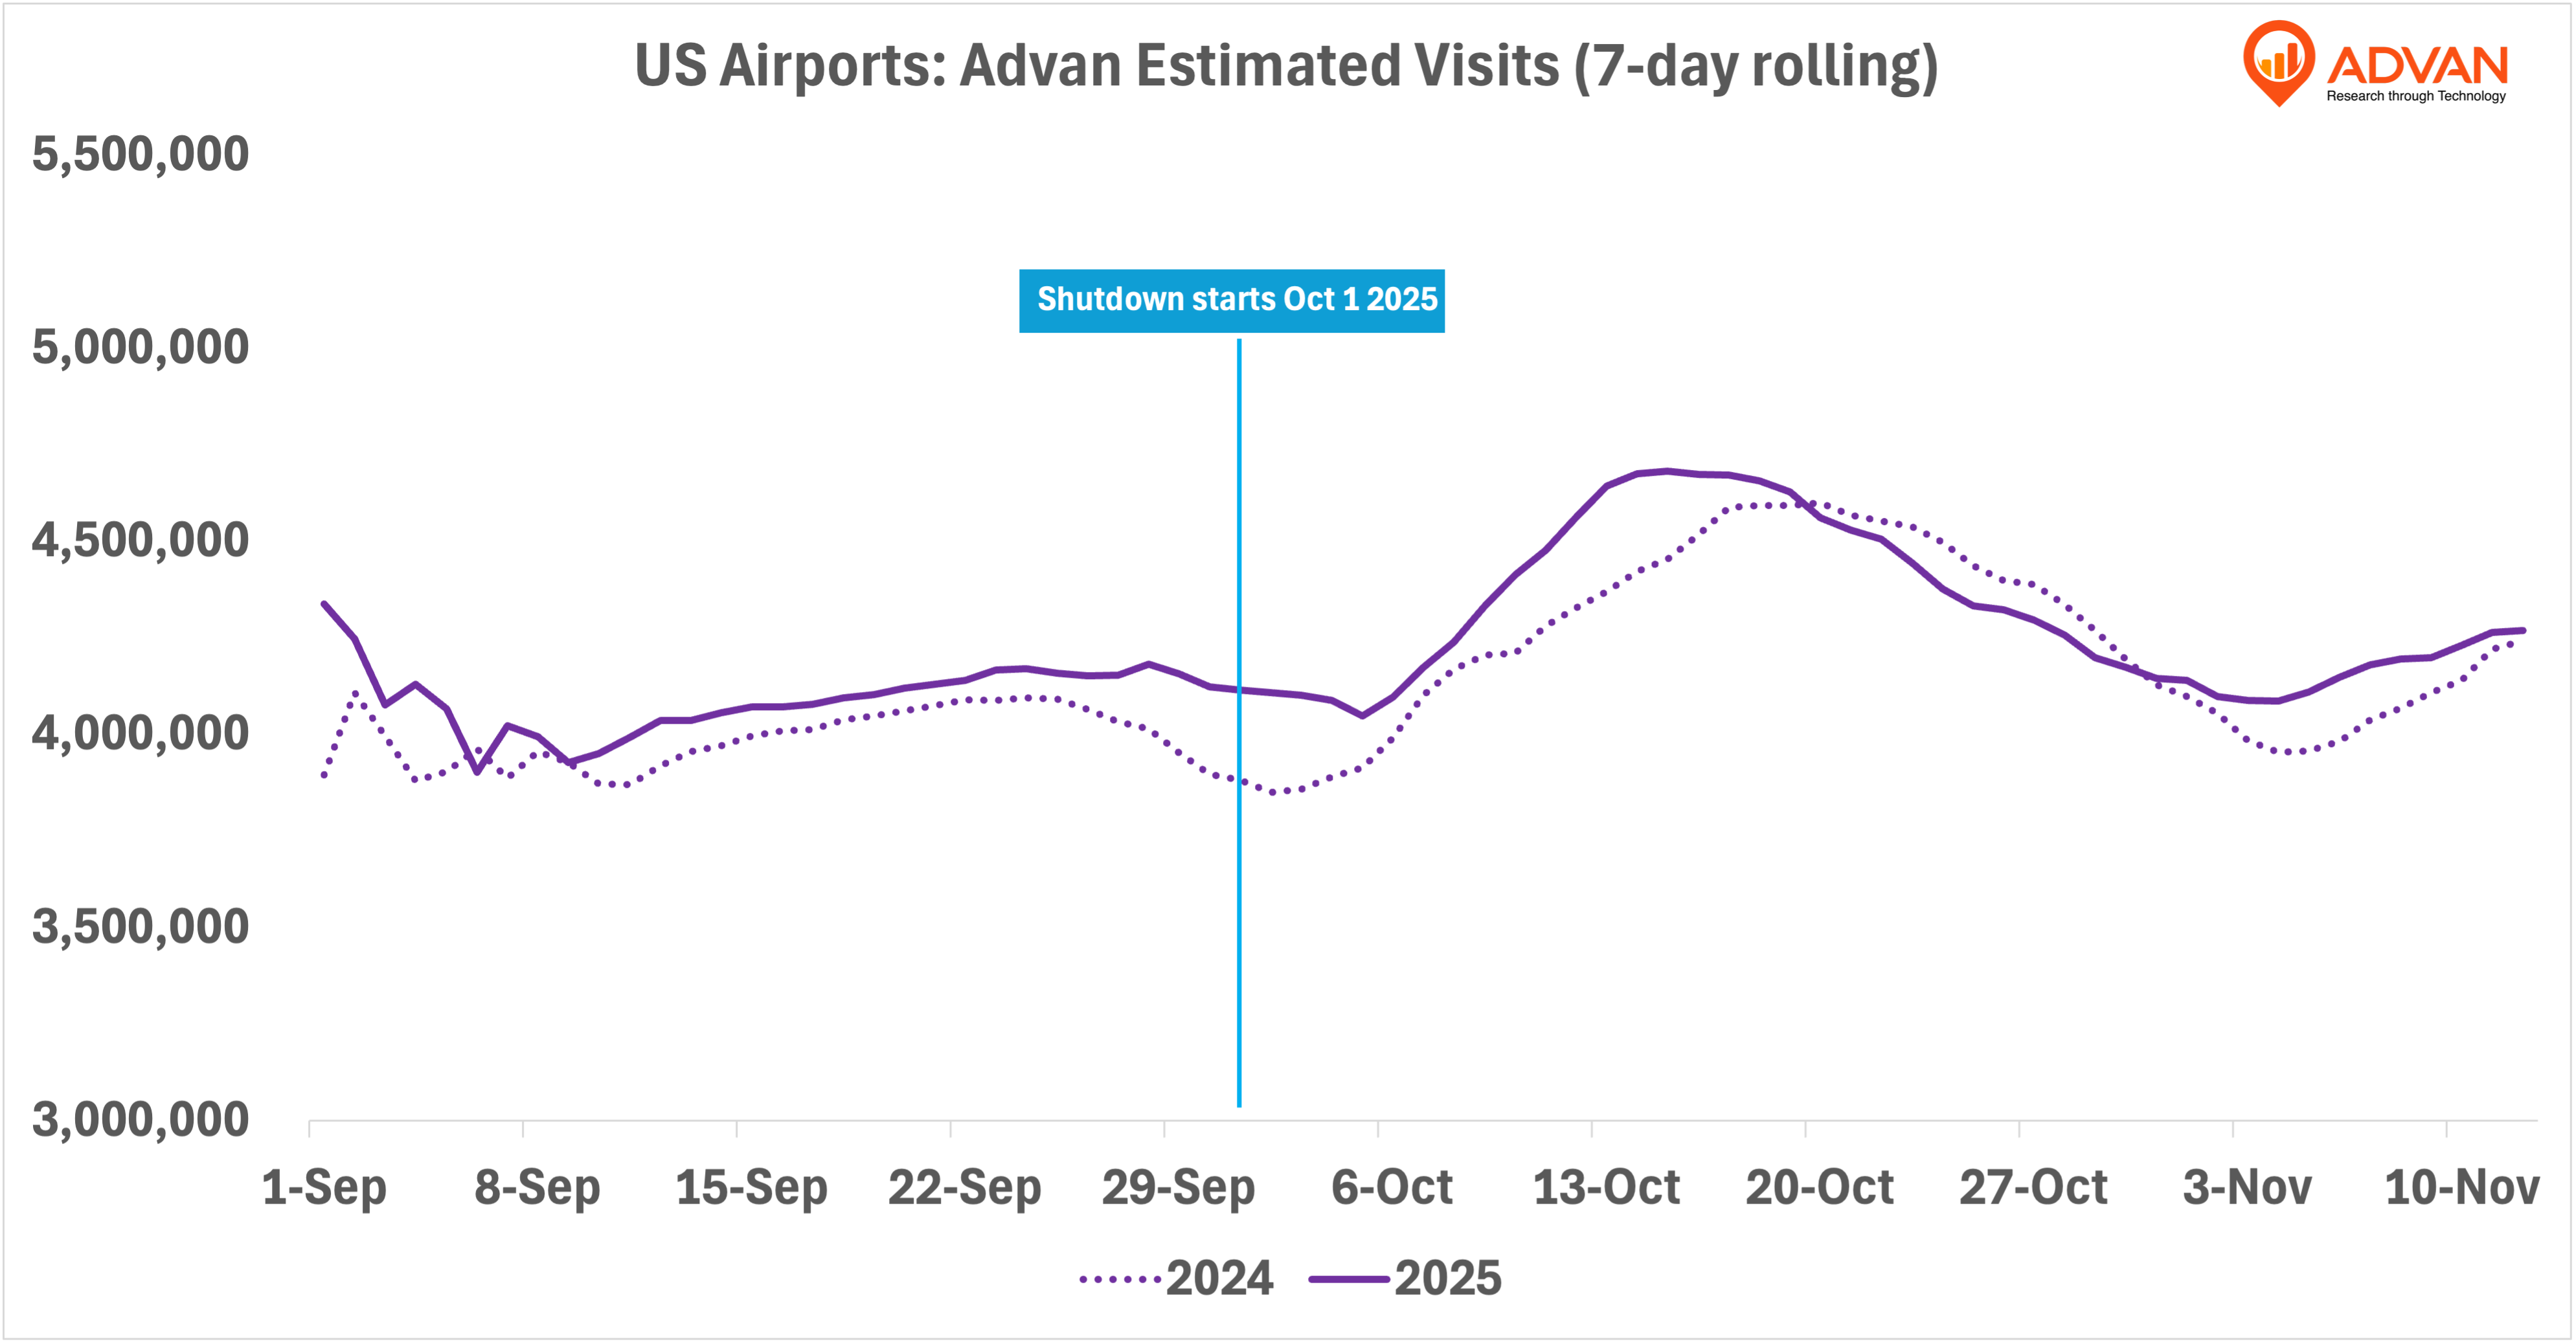
The above chart focuses entirely on Advan’s national airport visitation.
What stands out is how quickly 2025 recovers relative to 2024:
- The second half of October of 2025 dips slightly below the 2024 line
- But by late October, 2025 rises above 2024
- Visits peak near 4.8M in mid October 2025
- 2024 peaks slightly lower, around 4.5M
In other words ,even during the shutdown, people kept flying.
The demand side held steady. The operational pain we heard about wasn’t from fewer passengers, it was from the same or even more passengers moving through airports that suddenly had less staffing, tighter schedules, and forced flight reductions.
But this is the national view. The real story becomes clearer when we look airport by airport.
Some Airports Accelerated Into the Shutdown Fast
The chart below compares each airport’s traffic in September with the first two shutdown months (October & November).
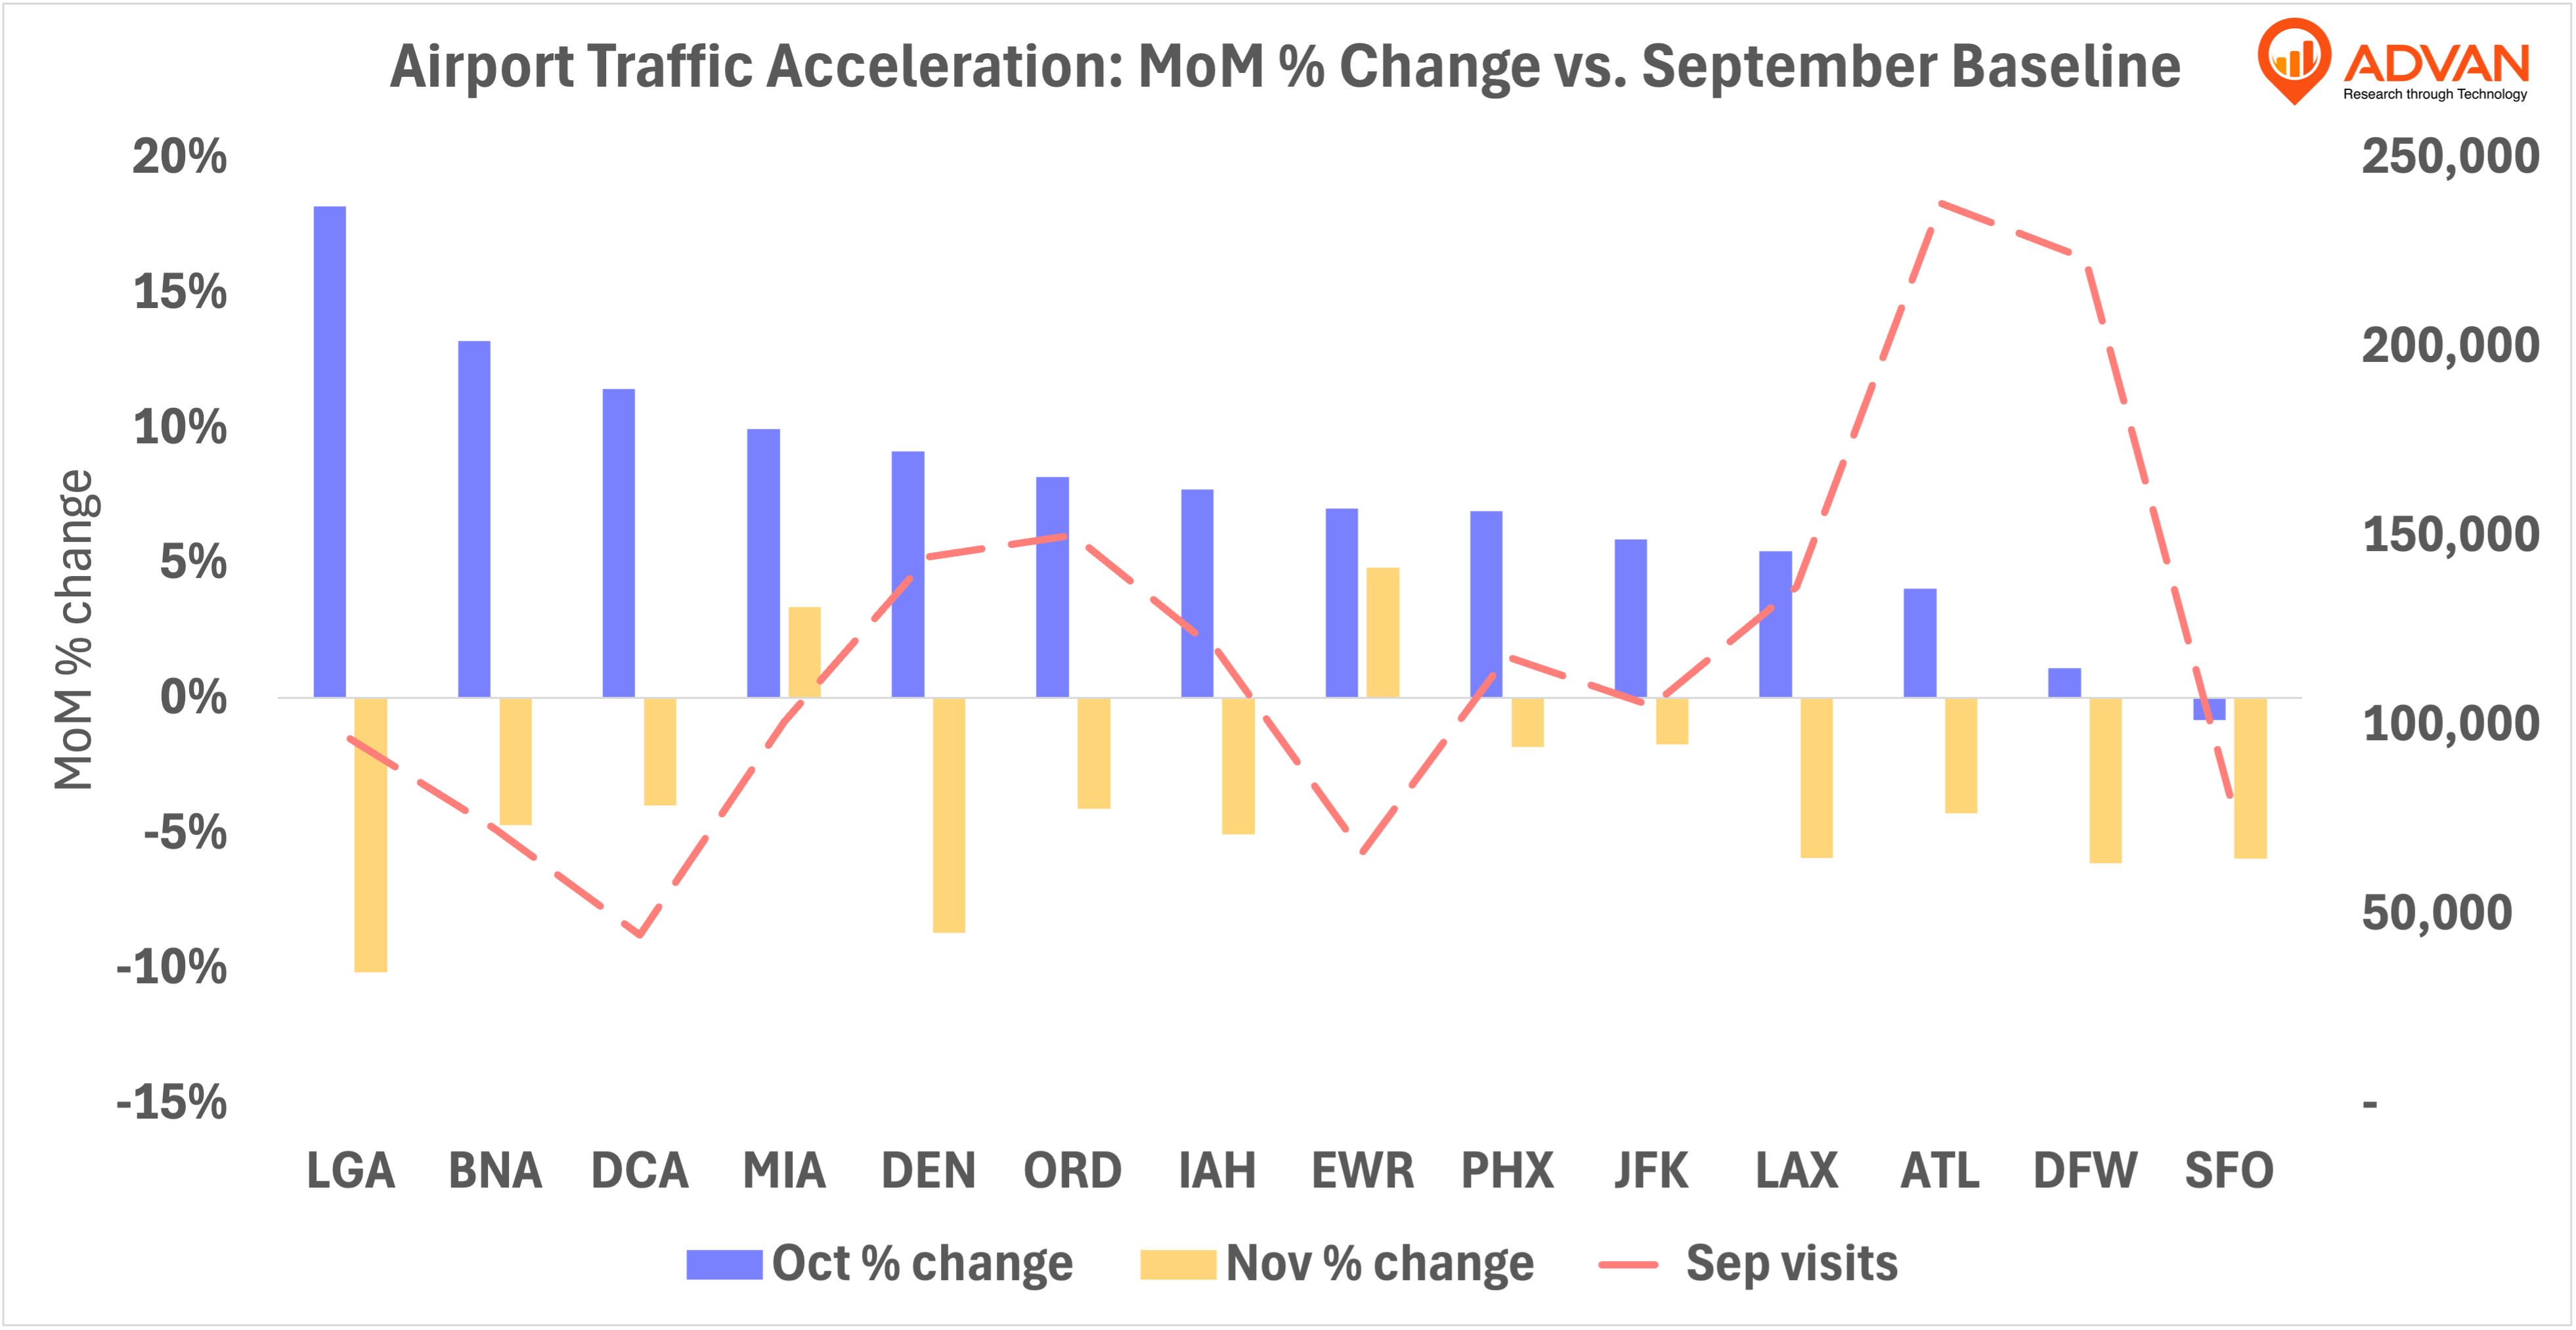
A pattern jumps out:
- LGA spikes the most, with October MoM around +18%
- Nashville (BNA) and DCA jump +13% and +12% respectively
- MIA, DEN, and ORD also increase between +8-10%
Meanwhile:
- SFO, JFK, ATL, DFW, and LAX saw more modest shifts, generally up to about +5% in October, followed by softer numbers in November, dipping roughly -1% to -5% relative to their September baseline.
The red dashed line (September baseline volumes) helps explain why this matters:
- Some airports had high absolute traffic in September and still accelerated
- Others started lower but shot up sharply into October
This makes one thing clear: the shutdown didn’t hit all airports equally. In fact, it pushed volume into very specific hubs.
The YoY Lens Confirms the Pressure Points
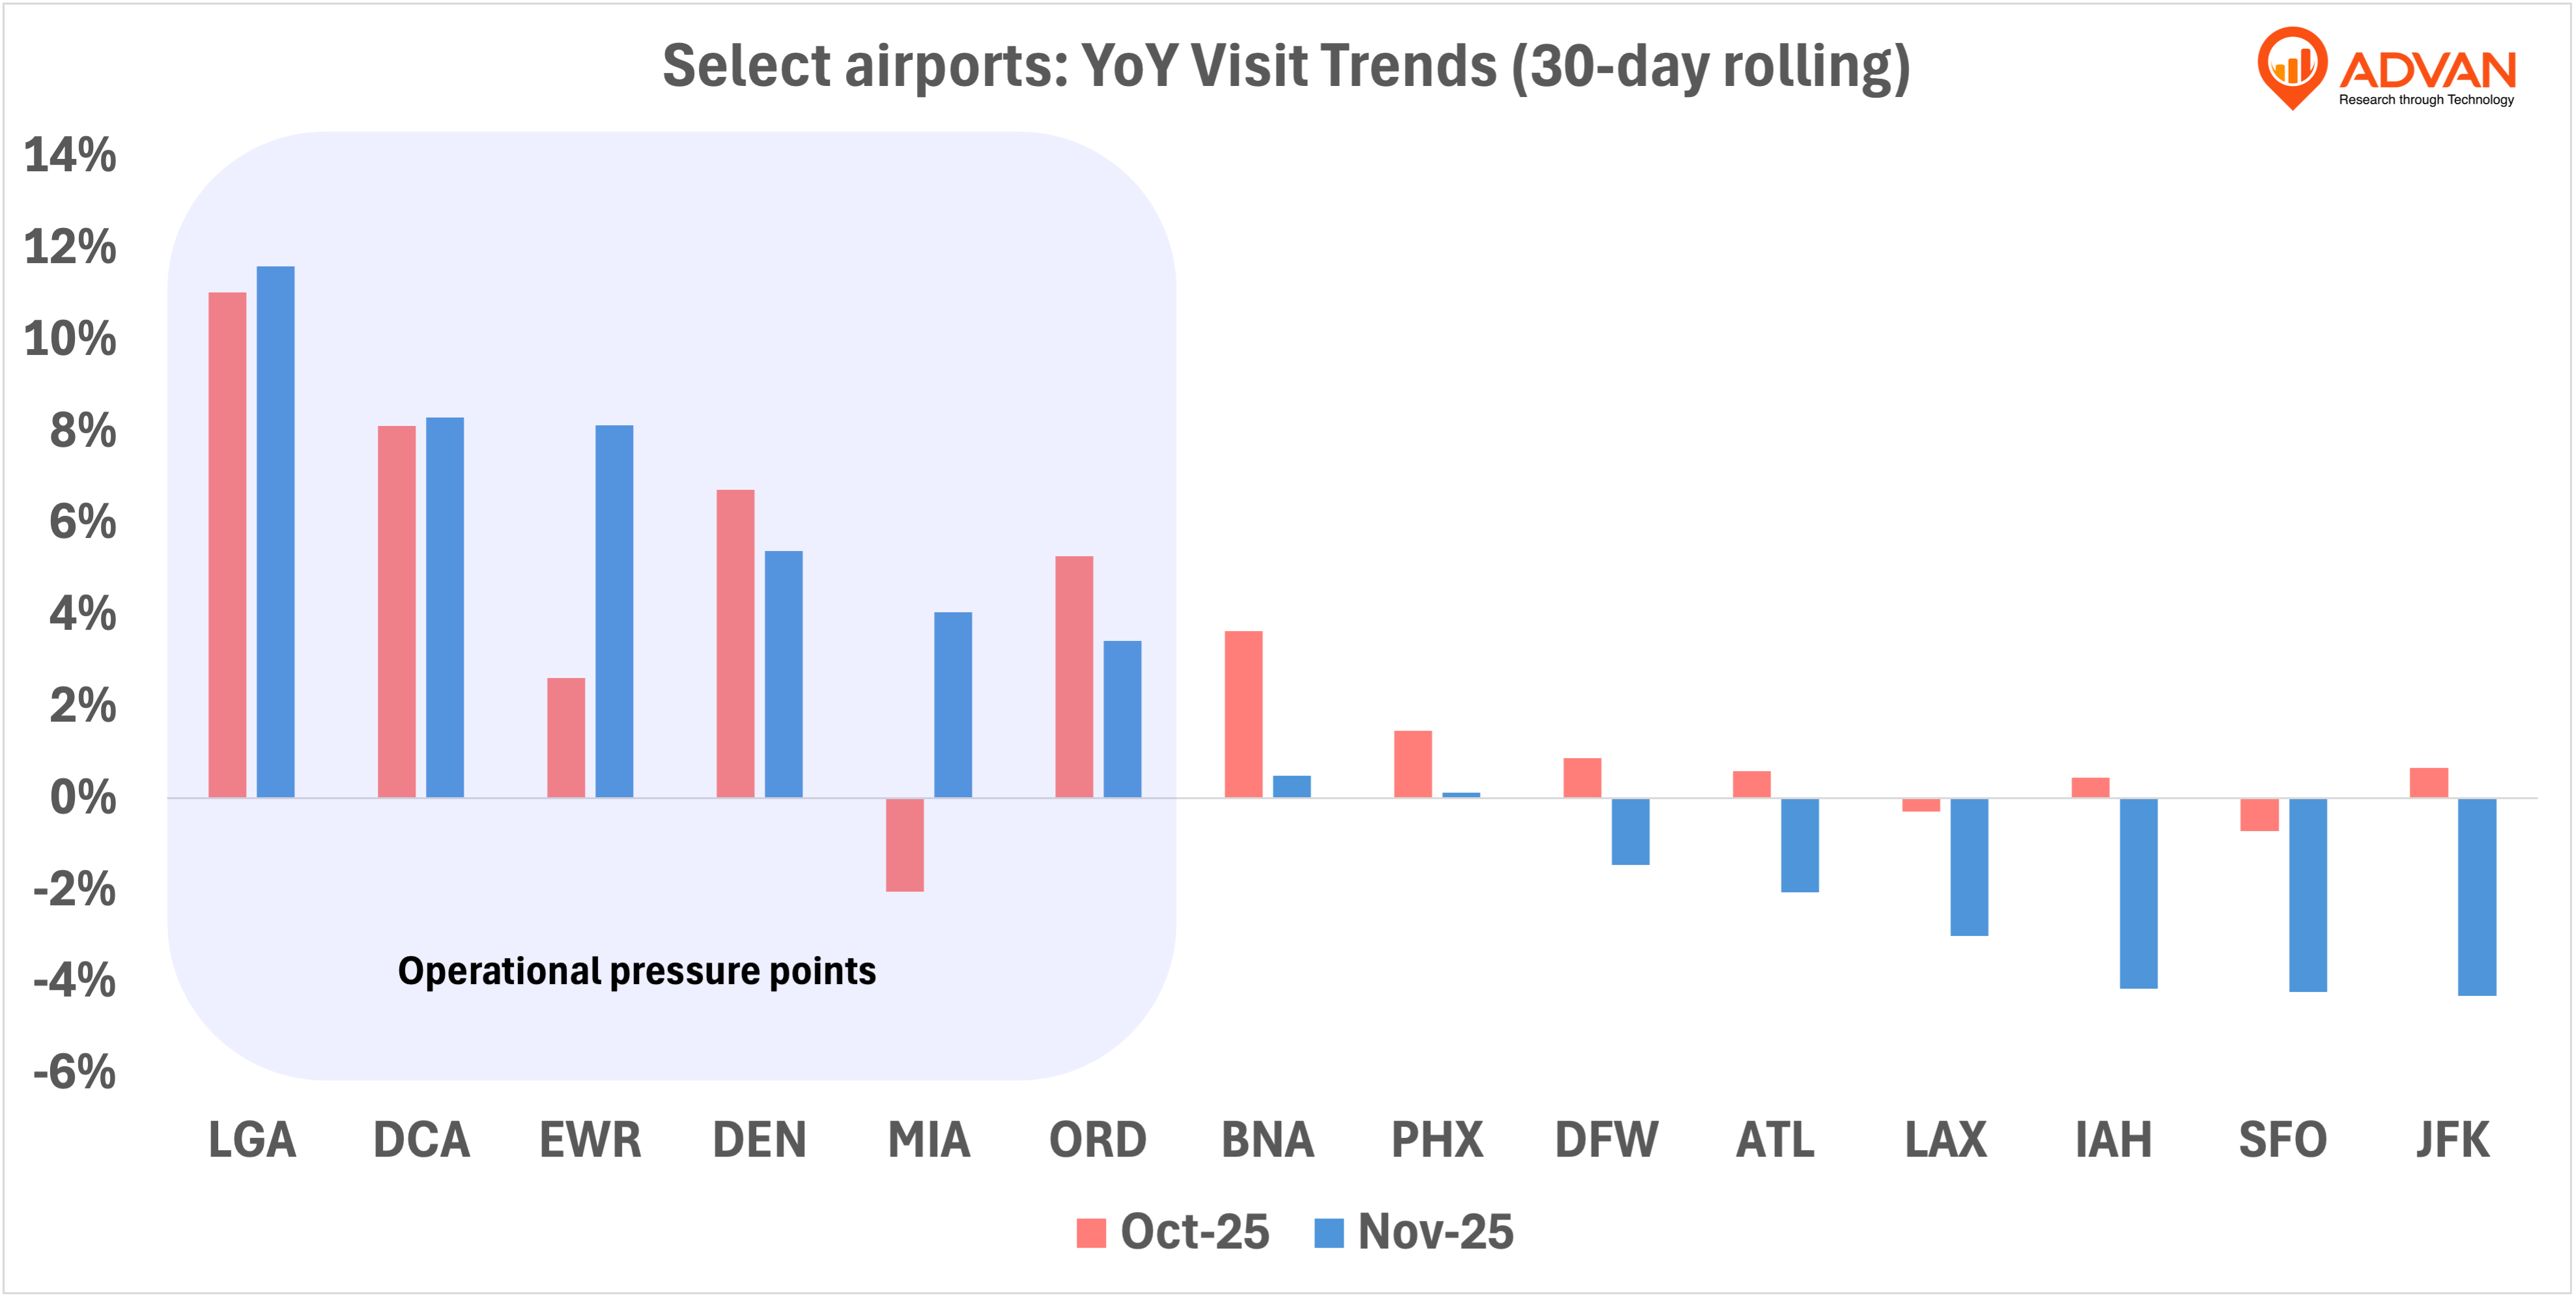
The YoY rolling comparison reinforces the same airports as stress zones.
In October and November:
- LGA runs +11% YoY
- DCA runs roughly +8% YoY
- EWR from +2% in October to +8% YoY November
- DEN around +6% YoY, down from +8% YoY in October
- ORD around +4% YoY, down from +6% YoY in October
These five airports show sustained, elevated YoY growth at a time the shutdown progresses.
Meanwhile, LAX, JFK, IAH, SFO remain flat or negative YoY. This reinforces the earlier point: the shutdown created localized congestion and not a national slowdown.
What About Congestion? Dwell Time Tells a Different Story
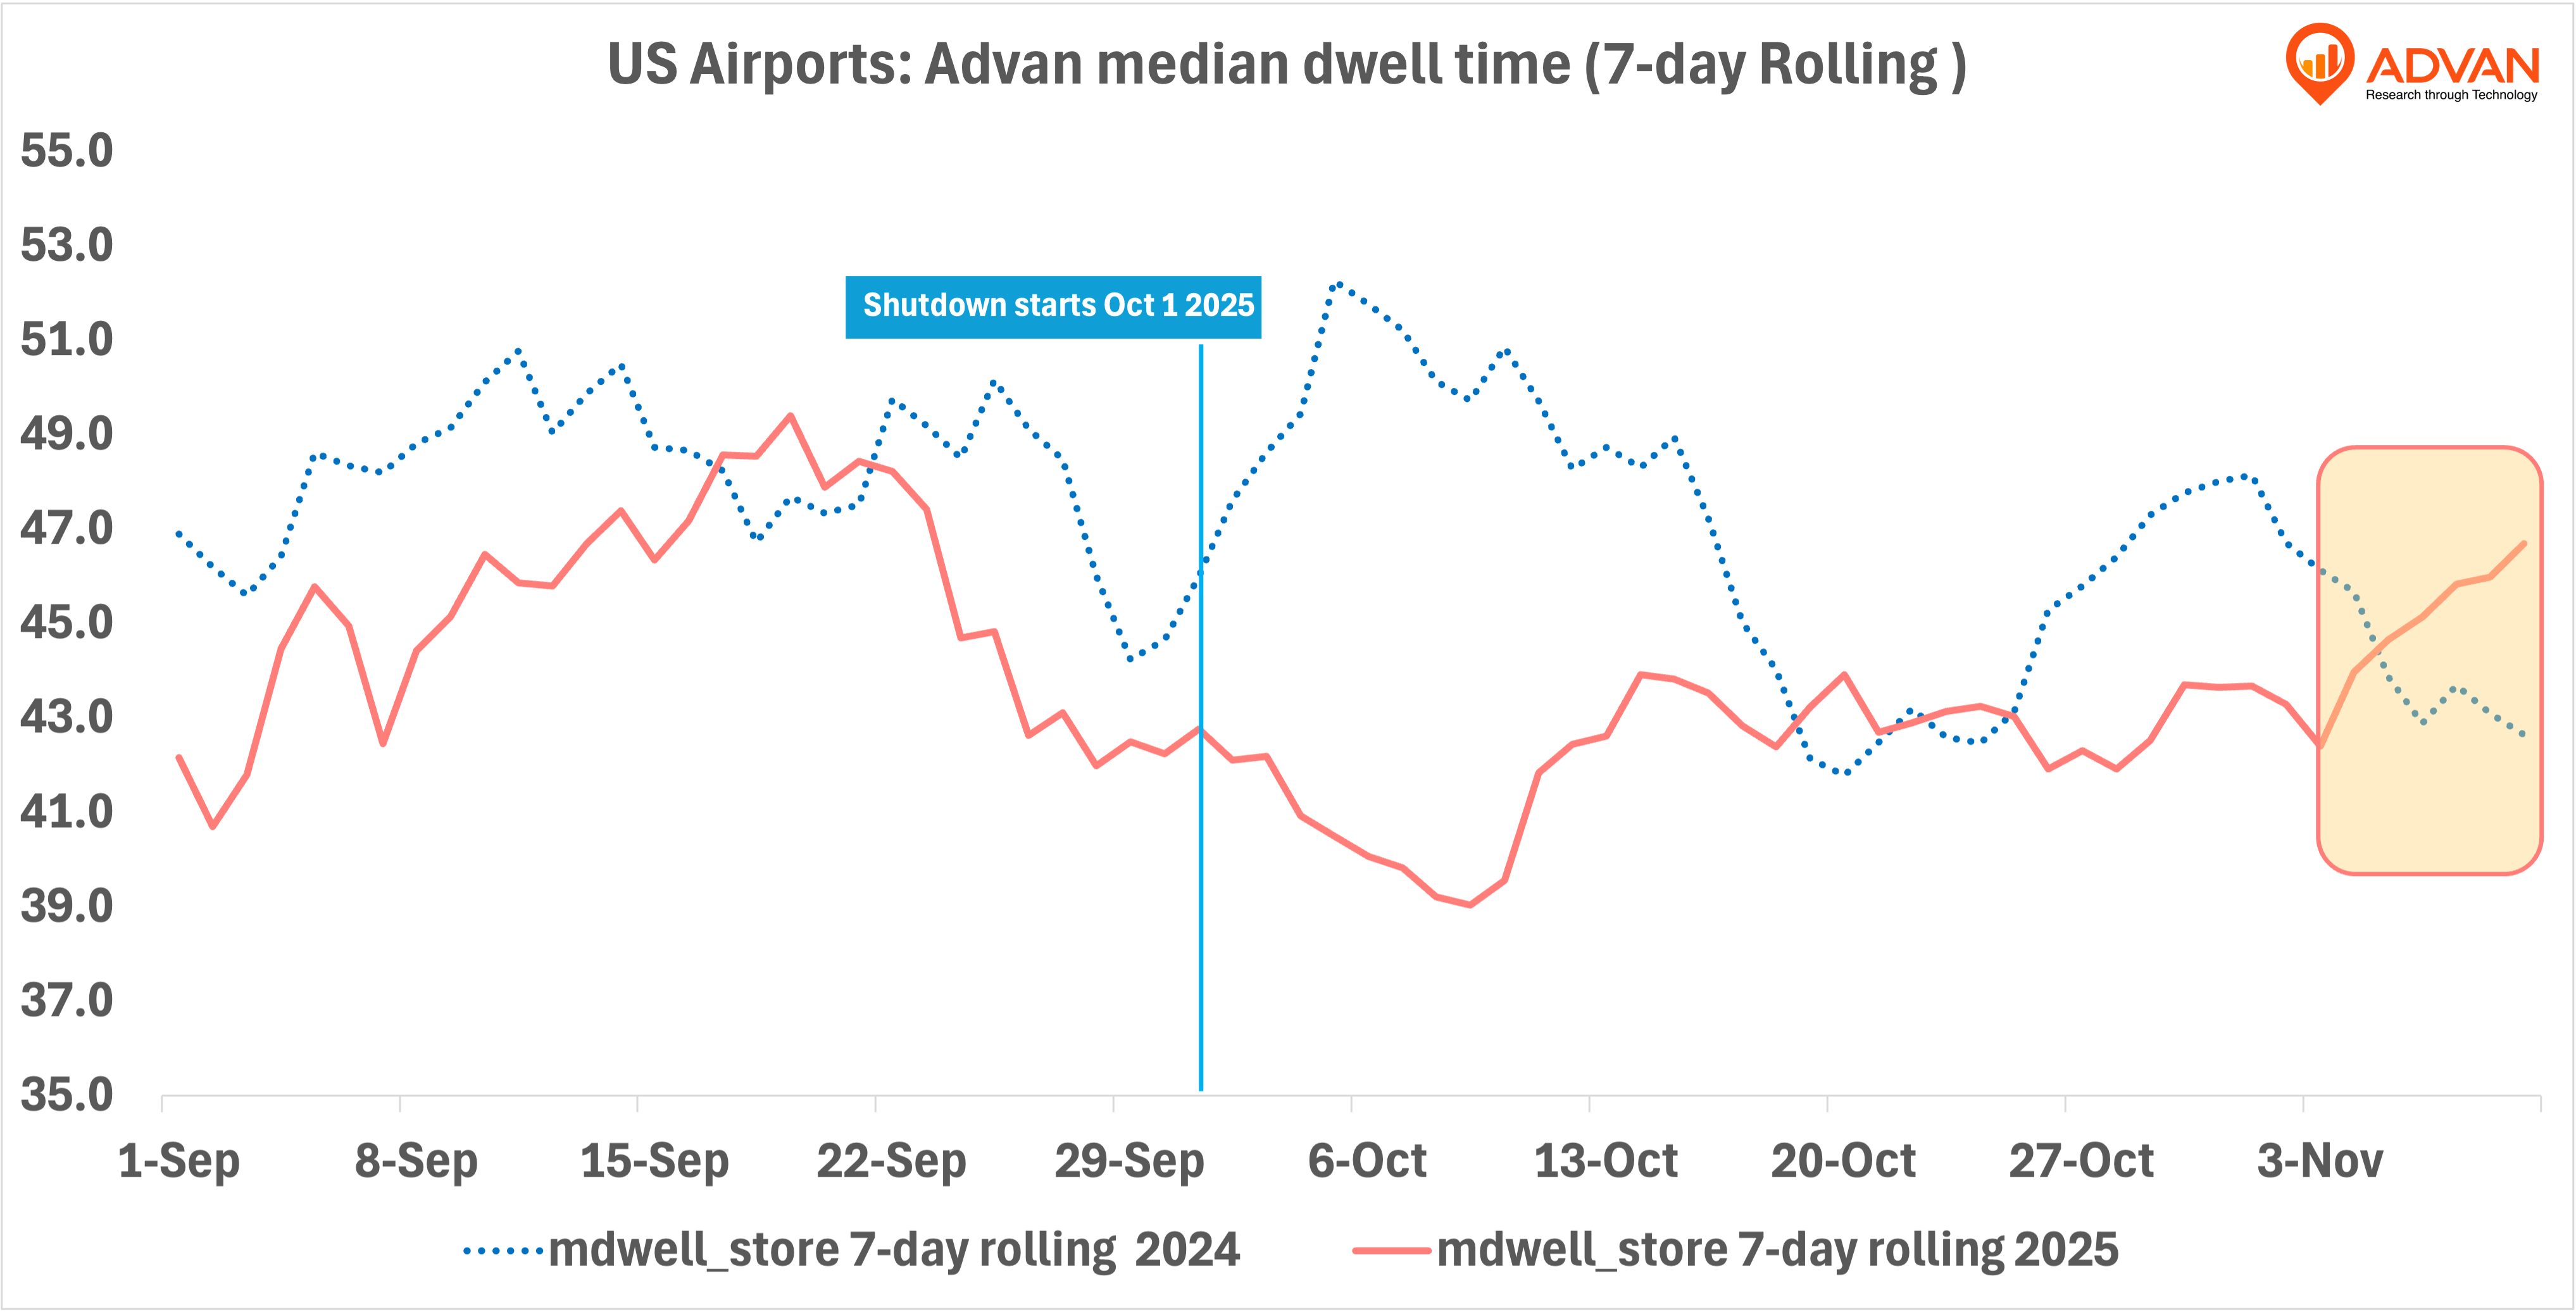
If the shutdown caused widespread delays, we’d expect to see median dwell spike.
But the chart shows the opposite:
- 2024 dwell climbs toward 50-53 minutes in October
- 2025 dwell drifts downward from about 47 minutes to 42-43 minutes
And even more interesting and here’s where the real impact starts:
- The late-October/early-November region (highlighted in yellow - data up to 11/9) shows 2025 increasing at a rate higher than 12% on average from early October, while 2024 declines.
Therefore this pattern suggests:
- No system-wide congestion
- No major increases in time-spent inside airports
- Any delays were concentrated and not large enough to shift the median at the national level
This is consistent with the YoY airport-level charts: pressure was heavy but uneven, not evenly distributed across the country.
So What Did the Shutdown Actually Do to Airports?
Based on TSA screening counts and Advan’s nationwide and airport-level visitation data, here’s the full picture**:**
- Demand stayed strong: Both TSA and Advan show stable or increasing activity through the shutdown.
- The impact was concentrated: LGA, DCA, EWR, DEN, ORD, and a few others absorbed most of the additional volume.
- The acceleration didn’t happen immediately: Most of the visible impact doesn’t appear until late October and November, when MoM growth pushes past seasonal norms and several airports spike into double-digit gains. In early October, the system still behaves relatively normally.
- Many airports accelerated right into October: MoM traffic growth at certain airports hit double digits, far above normal seasonal patterns.
- Congestion showed up late in dwell time: Median dwell in 2025 started below 2024 levels but began to climb in late October and continued to rise into roughly November 9, suggesting that the system took time to fully “feel” the shutdown’s operational effects.
- TSA passenger counts validates Advan: The 0.87 correlation between TSA screenings and Advan’s estimated visits confirms that the patterns we see are driven by real-world dynamics in the airports, not artifacts of the data.
When systems come under stress, the national averages can hide more than they reveal. But once you layer TSA’s ground truth on top of Advan’s airport-level signal, the pattern is clear: the shutdown didn’t simply “slow down” air travel, it reshaped where and when the pressure landed.