Advan Research
Login icon LOGIN
Consumer Discretionary Businesses see Light at the End of the Tunnel

Consumer Discretionary Businesses see Light at the End of the Tunnel

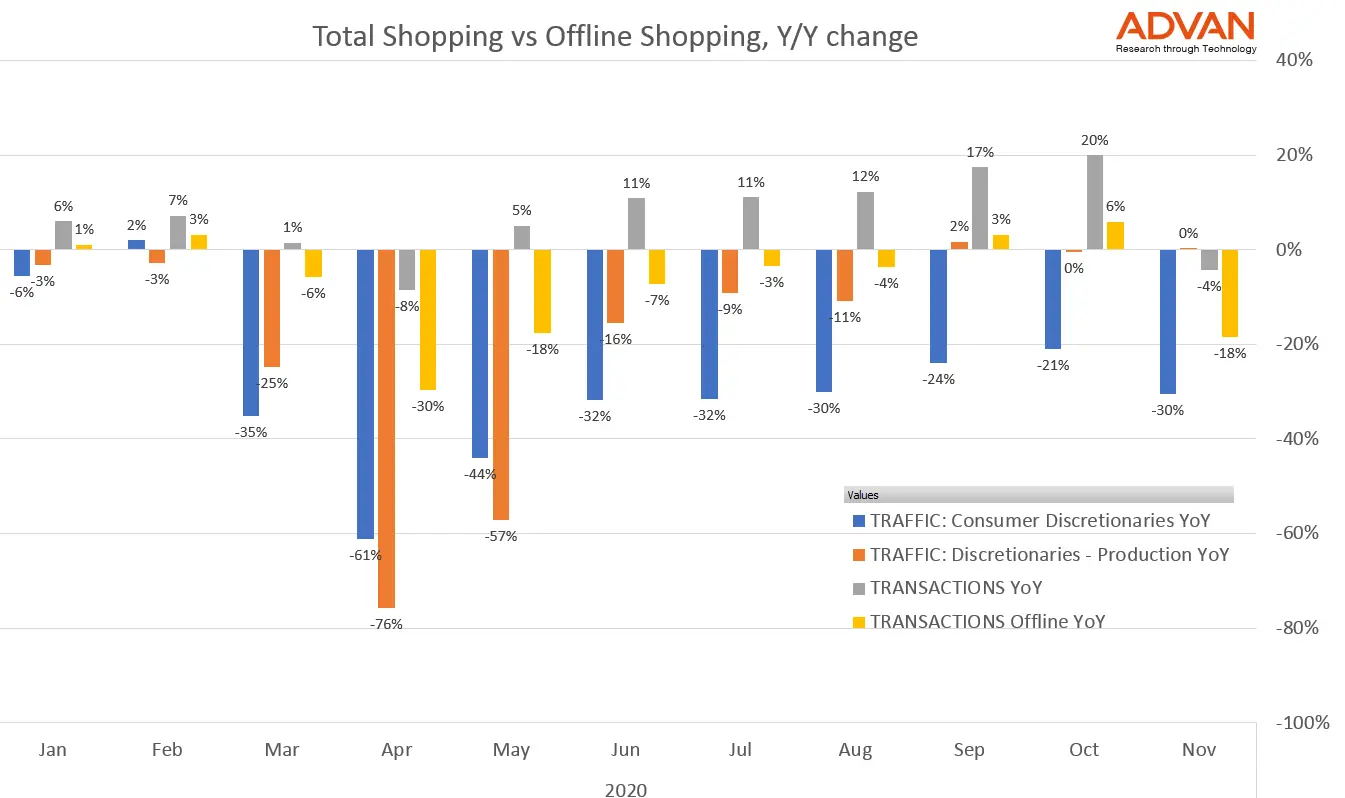
There is no question that a segment of retail has moved online this year. Offline (i.e.in-store) credit and debit card spending is down 15% year-over-year versus total spend according to transaction data from ConsumerEdge. Foot traffic at consumer discretionary store locations is also 20% lower year-over-year than foot traffic to production locations for consumer discretionary retailers. These parallel trends show us that foot traffic trends at store locations closely reflect offline spending, while traffic at production facilities gives us a window into total spend - both online and offline.
2 minutes
Airport Foot Traffic Shows 99% Correlation with TSA Screened Traveller Numbers

Airport Foot Traffic Shows 99% Correlation with TSA Screened Traveller Numbers

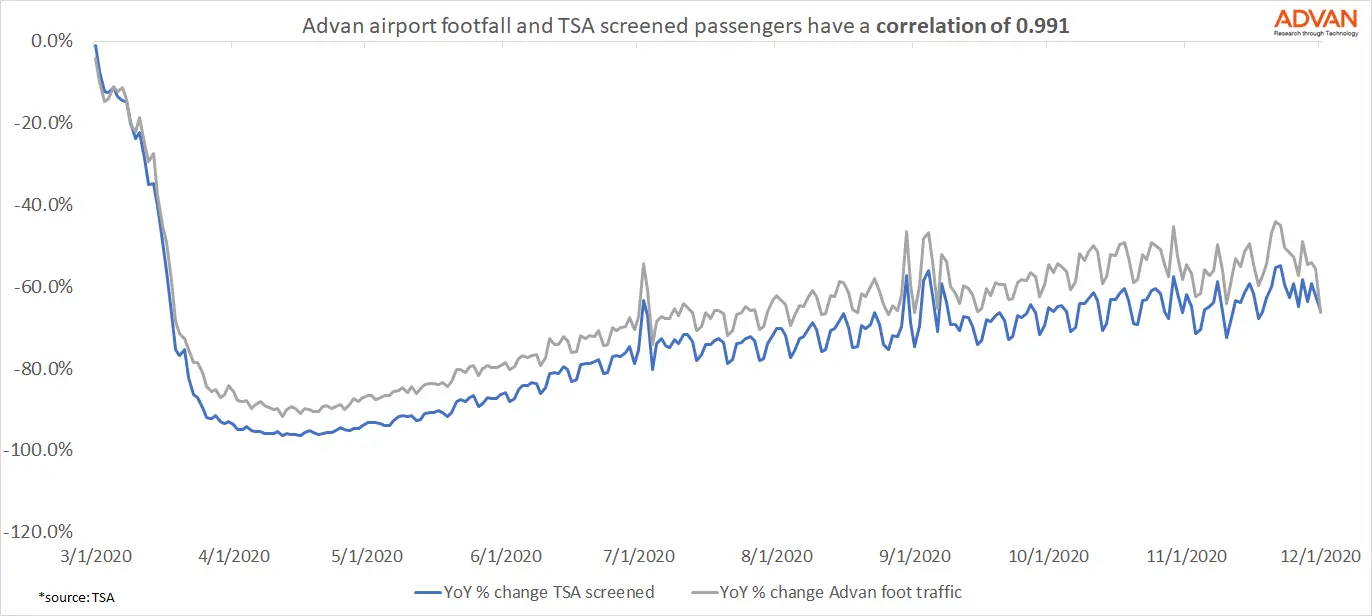
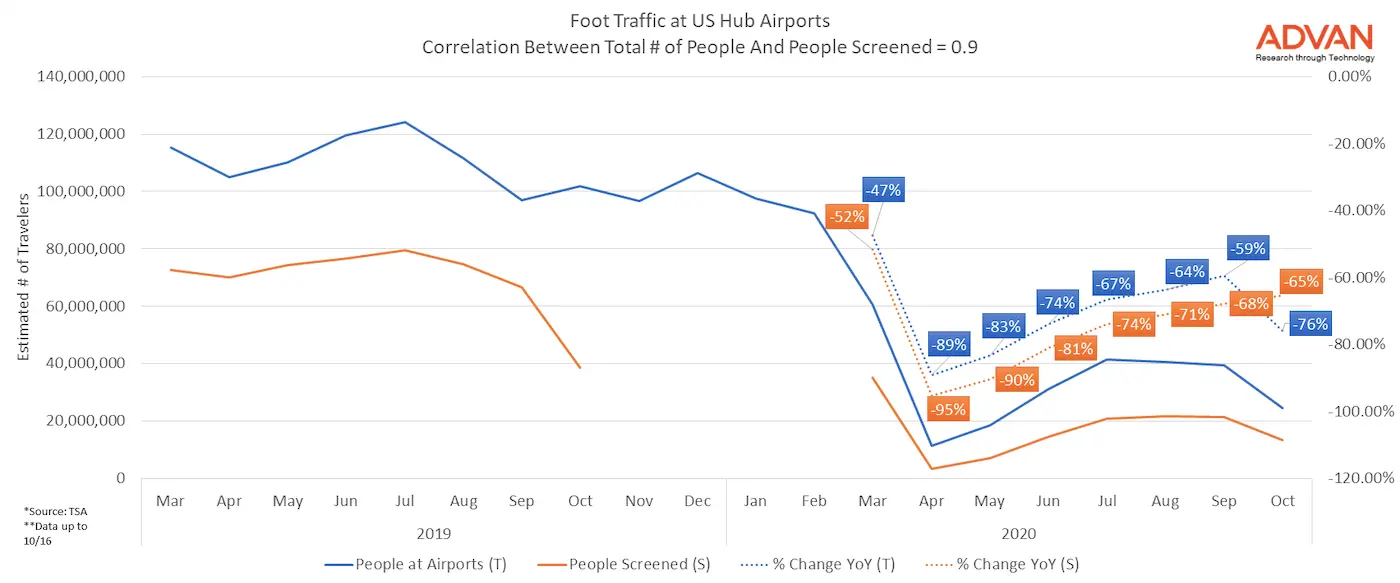
Advan analysis of footfall at US airports shows a gradual upward trend in traveller numbers, although volumes still remain significantly depressed compared to March. Comparison with TSA screened passengers shows a very high correlation over time, of over 99%. This means that foot traffic data provides almost 100% confidence in showing the number of travelers passing through airports in the US. Follow us on Twitter and LinkedIn .
One minute
Black Friday Suffers Pandemic Blues

Black Friday Suffers Pandemic Blues

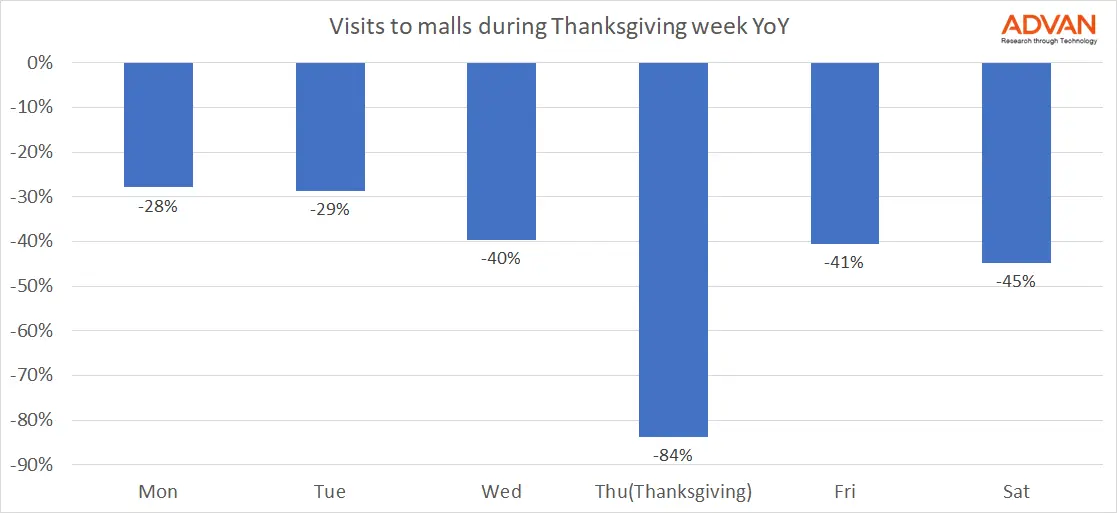
Malls around the US suffered a significant blow during what is usually the busiest shopping weekend of the year. Foot traffic was down 41% year-over-year on Black Friday and 45% on Saturday. As we reported in our blog post last week, there was a pick-up in traffic during the first three weeks of November as many people opted to take care of their shopping sooner, in order to beat the rush and in anticipation of lock-down orders across the country.
2 minutes
As UK Enters Second Lockdown, New Patterns of Behavior Emerge

As UK Enters Second Lockdown, New Patterns of Behavior Emerge

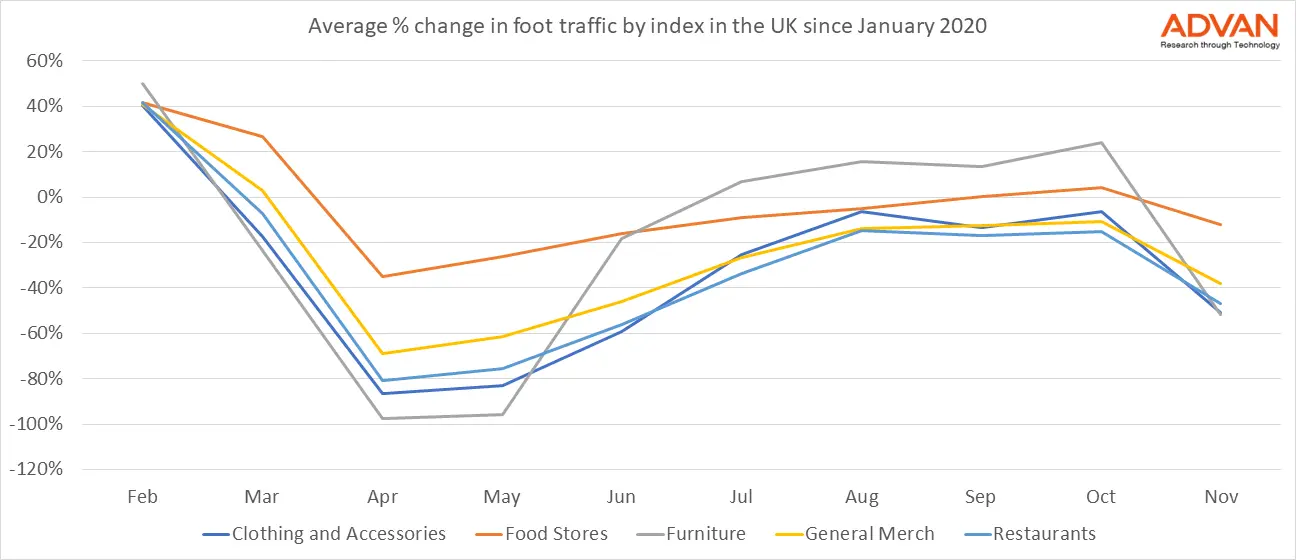
With the UK now in its second week of nationwide lock-down we are starting to see some familiar patterns of behavior based on analysis of foot traffic data. But there are also some significant differences compared to the first wave. We looked at 5 indices for key sectors. All of our comparisons are against the average footfall in January 2020, as a pre-COVID benchmark. In April, when the majority of businesses were closed, foot traffic fell by 80% or more across almost all sectors, with the exception of those in our food stores index.
2 minutes
Pandemic Migrants Signal Changing Attitudes Towards Living in Major Cities

Pandemic Migrants Signal Changing Attitudes Towards Living in Major Cities

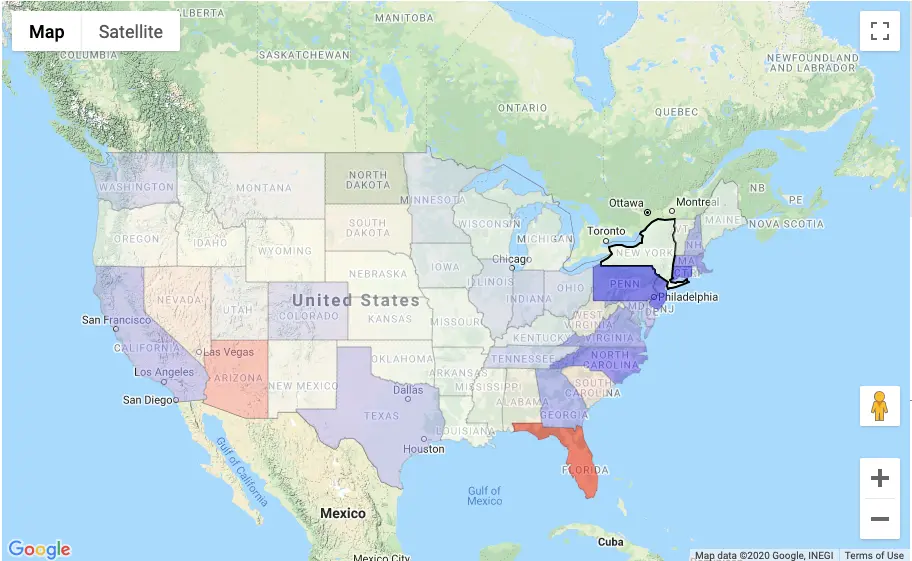
Among the many social and cultural changes that the pandemic has brought about, arguably the most impactful will be the ways in which it has influenced our decisions about where to live. Not just temporary relocations while we ride out lock-downs and WFH, but permanent migration that will alter how we live and how we spend. Mobility data allows us to see these patterns in almost real time and our recently launched REPerspectives portal allows us to easily visualize where people live and where they are moving to, at any census level.
2 minutes
Tentative Comeback for US Airports

Tentative Comeback for US Airports

In our recent webinar, we spent some time looking into foot traffic trends at airports in America and Europe. Location data is a very reliable proxy for airline passengers, since there are few reasons to be at an airport other than to board a plane. Precise mapping can filter out people who have come to collect or drop off passengers from those who have passed security in order to catch a flight.
2 minutes
Which Banks are Back in the Office?

Which Banks are Back in the Office?

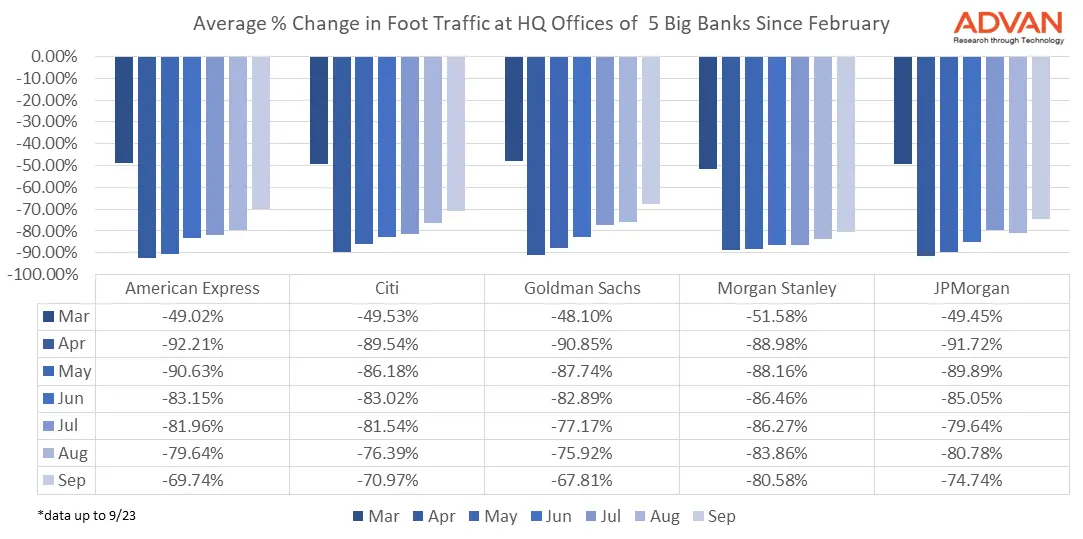
Are you back in the office? It’s a question many of us find ourselves asking our friends and peers. The answer is, it depends. Each has their own comfort level, and it also depends largely on their role and their employer. Morgan Stanley announced in May that it would start bringing traders back to the floor in June. Most recently, JP Morgan made a similar announcement - those in sales and trading roles returned on September 21.
2 minutes
Clothing and Accessories Down, Home Improvements Up: Foot traffic indices paint picture of vast differences between sectors in the US

Clothing and Accessories Down, Home Improvements Up: Foot traffic indices paint picture of vast differences between sectors in the US

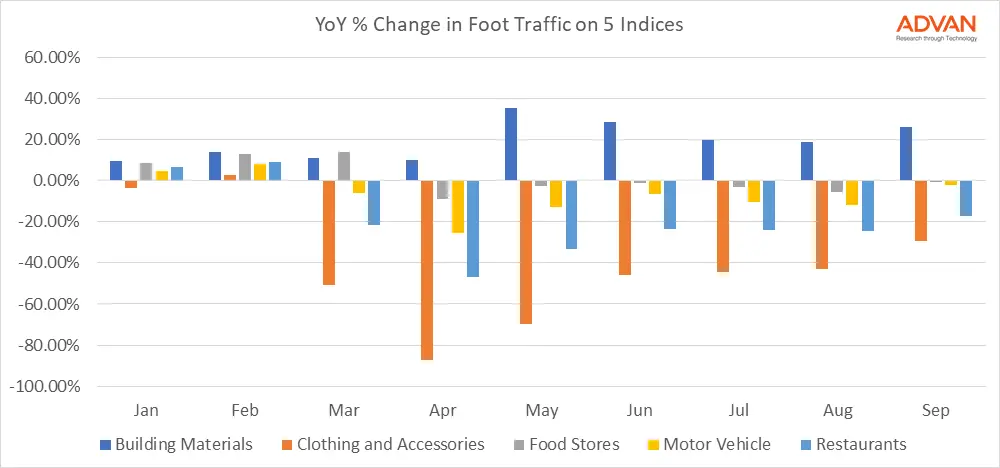
What does a COVID recovery look like for businesses? 6 months after the initial lock-down we know that, in the US, the journey has been remarkably different for different types of businesses. Our foot traffic indices capture trends that show just how varied the path has been. We looked at the percentage change in foot traffic for 5 different sectors during each month of this year. Starting in March, of those we analyzed, the sectors most quickly impacted were clothing & accessories.
2 minutes
Bifurcation in Auto Industry as Detroit 3 Bounce Back Faster than Rivals

Bifurcation in Auto Industry as Detroit 3 Bounce Back Faster than Rivals

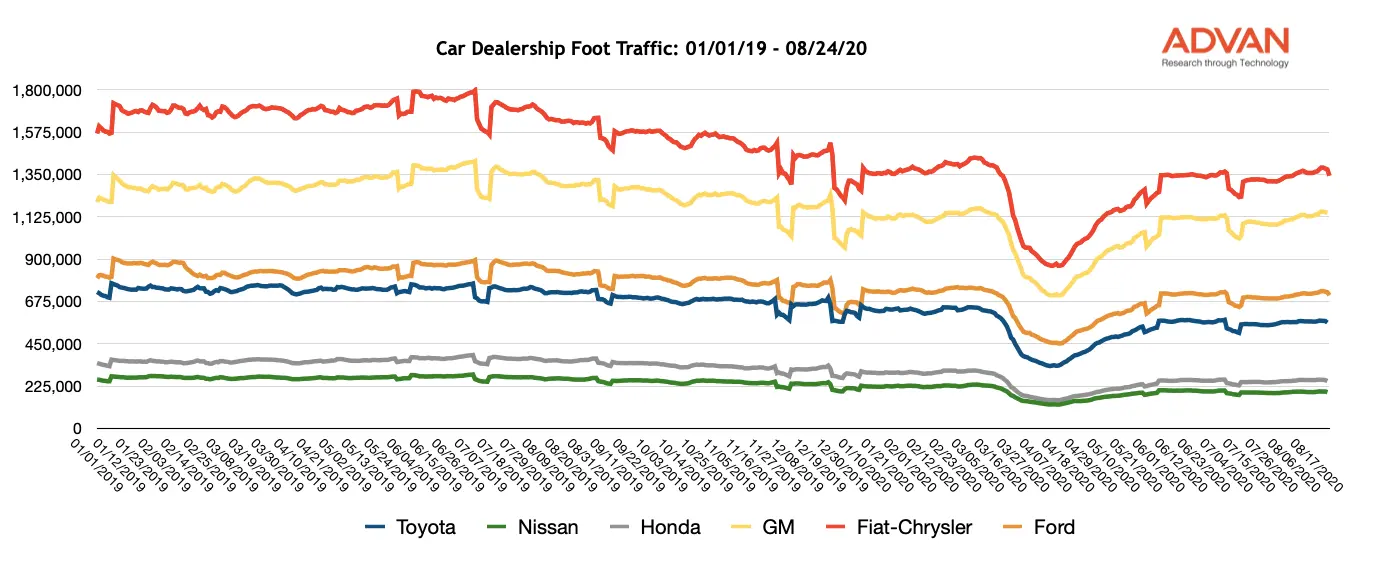
Recovery in Foot Traffic Levels at Car Dealerships Most Pronounced in Red States Like many other sectors, the US car industry saw a sharp downturn in business when lock-down orders and business closures were at their peak in late March and April. Combined sales in April 2020 for the Big 3 US carmakers - GM, Ford and Fiat-Chrysler - were down 63% compared to the previous year according to GoodCarBadCar.net.
3 minutes