Advan Research
Login icon LOGIN
Clothing and Accessories Down, Home Improvements Up: Foot traffic indices paint picture of vast differences between sectors in the US

Clothing and Accessories Down, Home Improvements Up: Foot traffic indices paint picture of vast differences between sectors in the US

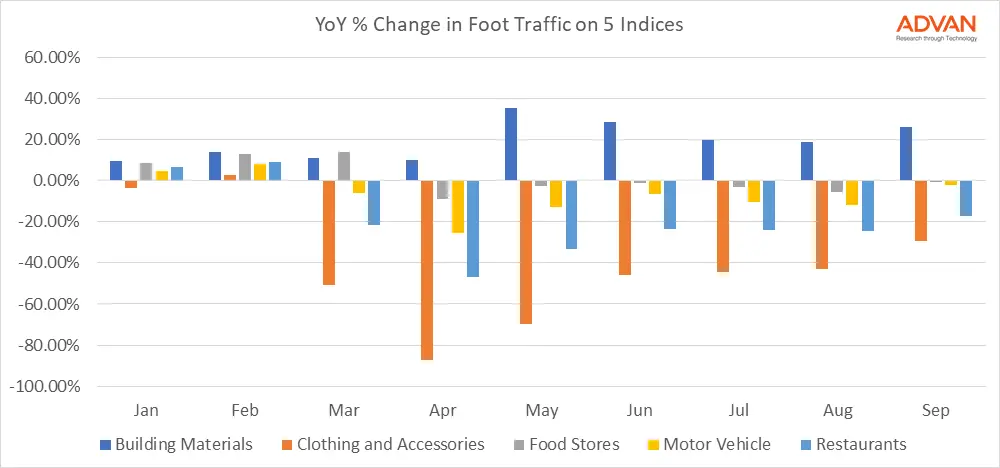
What does a COVID recovery look like for businesses? 6 months after the initial lock-down we know that, in the US, the journey has been remarkably different for different types of businesses. Our foot traffic indices capture trends that show just how varied the path has been. We looked at the percentage change in foot traffic for 5 different sectors during each month of this year. Starting in March, of those we analyzed, the sectors most quickly impacted were clothing & accessories.
2 minutes
Real-Time Same Store Sales Data Supports Revenue and Earnings Predictions

Real-Time Same Store Sales Data Supports Revenue and Earnings Predictions

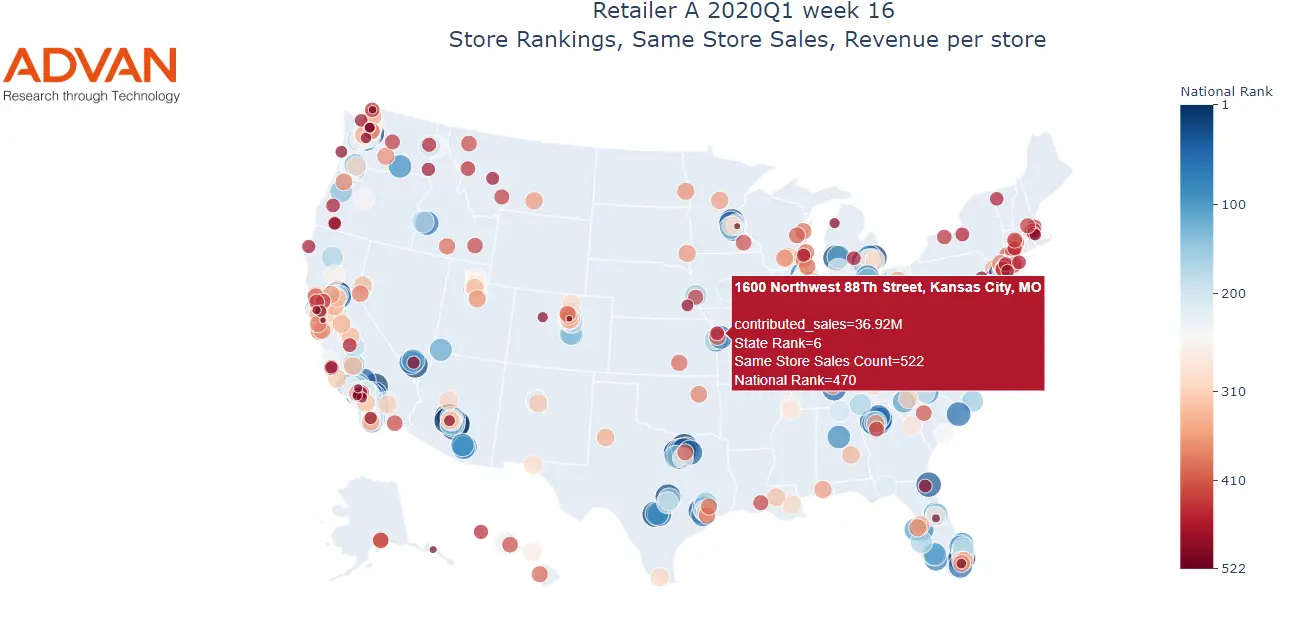
The current and forthcoming earnings seasons will be one of the most unpredictable many of us have encountered. Anticipating and modelling sales performance will be challenging on multiple levels, given massive disparities across the country in terms of store openings and closing. With the ability to monitor daily foot traffic at every store in the country, Advan’s location data provides the unique ability to identify which stores are open or closed in almost real time.
One minute

Using our Global Sector Tracker to Map Recovery Trends

Those of us based in the US and particularly in hard-hit states like New York have been keeping a close eye both on news about reopening our states, and on infection rate data across the country, to help us understand what the coming months may look like. Around the world, countries are very different stages of infection and recovery. For investors there are lessons to be learned from around the world given the different timelines and approaches for managing the pandemic, and varying strategies for recovery.
2 minutes
Back-to-work: A Look Across the Country

Back-to-work: A Look Across the Country

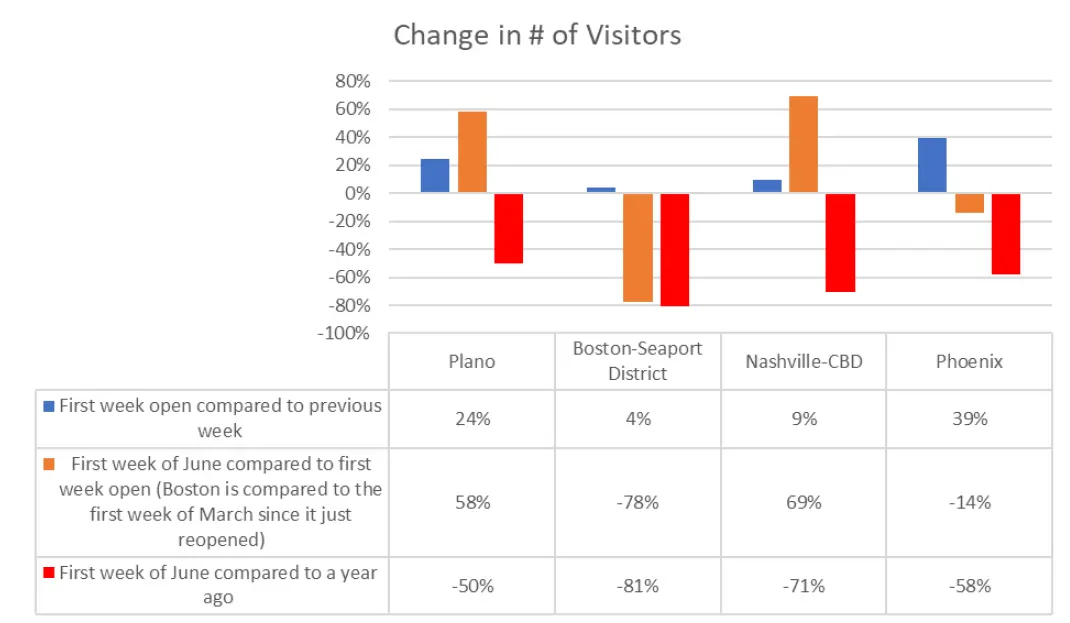
Building on previous posts from Advan Research and Eigen10 Advisors using anonymized cell phone movement over time to analyze the impact of Covid-19 on various real estate property segments, this week we explore the different experiences metro areas have had returning to the office. The market areas were chosen to represent a cross-section of the country, which had their own set of stay in place orders, and in turn, timing of a return to work.
3 minutes
Disruption 2020: Back To Work?

Disruption 2020: Back To Work?

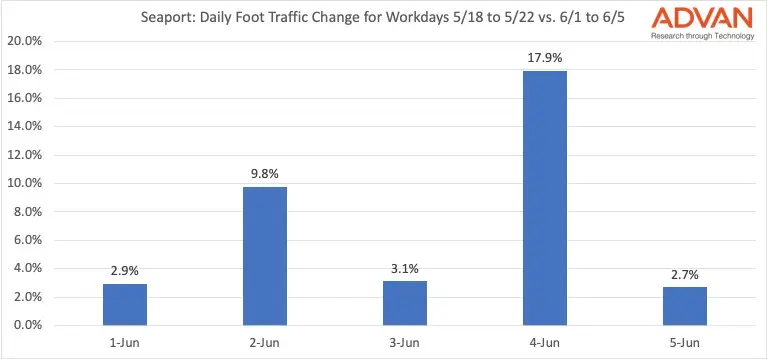
Monday was the first day non-essential office workers could return to work in Boston. There was NO rush back to the office. Using mobile tracking data from Advan Research, overall foot traffic was up 7.3% in the Seaport waterfront last week compared to 2 weeks ago. Compared to one-year ago, foot traffic is down 83%. Numerous employers have pushed back their plans to return to the office between Independence Day and Labor Day, significantly limiting overall foot traffic for the foreseeable future.
2 minutes
Tracking Restaurant Recovery as Social Gathering Accelerates

Tracking Restaurant Recovery as Social Gathering Accelerates

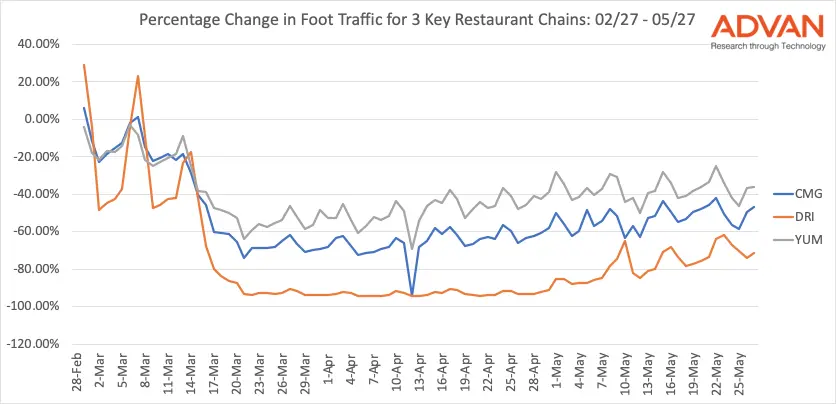
As the US restaurant sector starts to get back on its feet, we have been monitoring foot traffic numbers with interest to see which are turning around most quickly. The 3 chains we analyzed saw significant falls in traffic between mid-March and the end of April. This was most dramatic for Darden, where foot traffic fell to almost zero given the sit-down nature of the chain’s restaurants. Yum brands saw a 60% fall in foot traffic at the nadir and Chipotle a 70% drop.
2 minutes
Traffic data shows how fast US behavior is reverting to old patterns

Traffic data shows how fast US behavior is reverting to old patterns

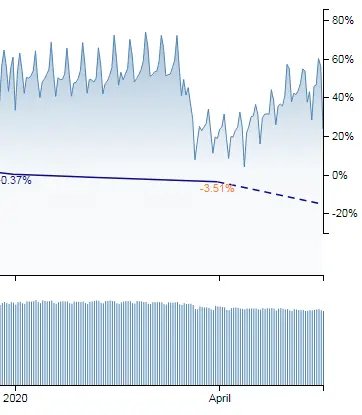
Geolocation data gives us an almost infinite number of ways to track and measure the extent and impact of relaxing social distancing measures, such as we are starting to witness in many states across the country. For us – based on our extensive analysis of this kind of data – “miles driven” is a key leading indicator of behavior. Our proprietary miles driven index is an accurate way to track how many miles individuals in the US are driving on a daily basis.
2 minutes
County by county analysis of Hotspots shows US population congregating in larger groups

County by county analysis of Hotspots shows US population congregating in larger groups

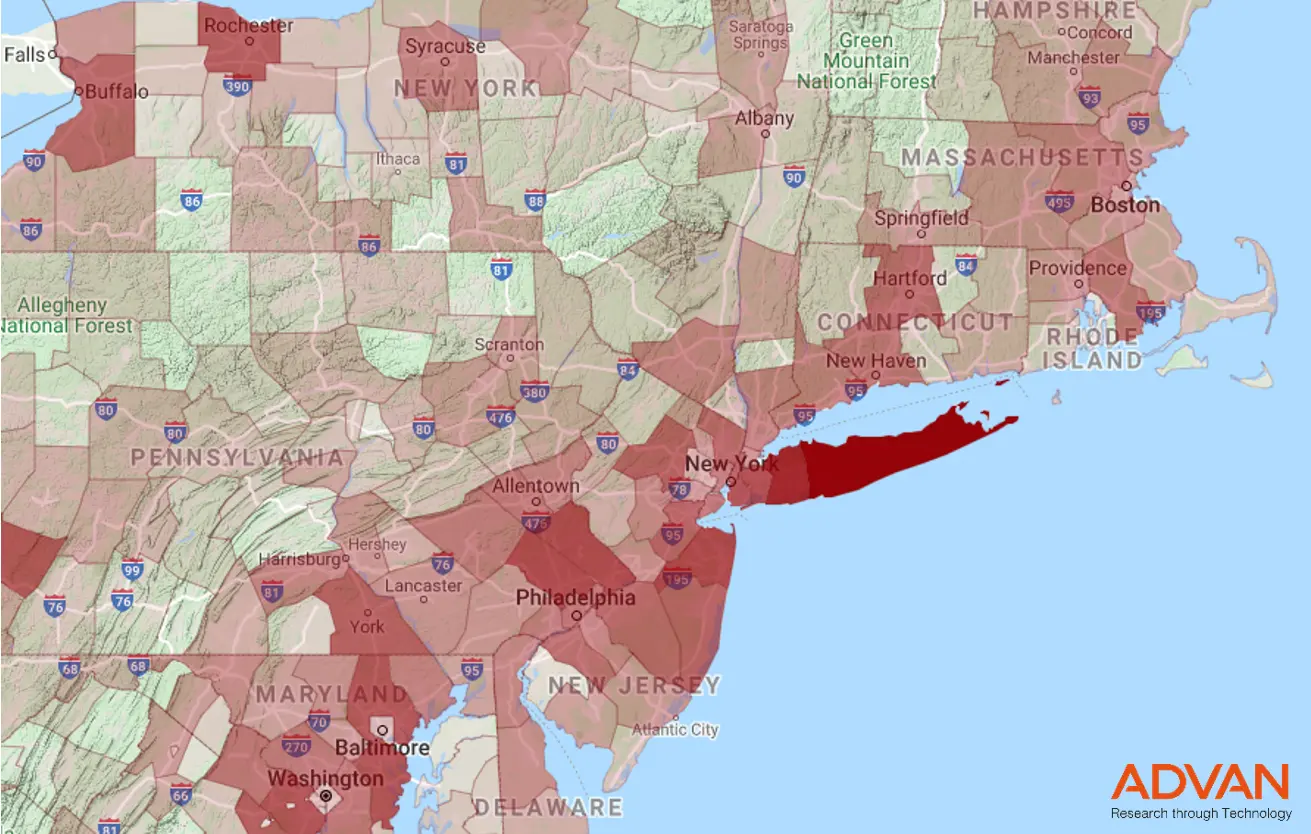
Authorities around the world are working hard to understand how people are altering their behavior as rules around social distancing begin to change. Gathering data on where people are congregating is a valuable measure for understanding risks and calculating the likelihood of a second wave of infections. To help provide these insights, we developed our Hotspots map. We define a Hotspot as a city block in which more than 50 people are gathered at the same time for more than 15 minutes - excluding homes and other residences.
2 minutes
The unique value of geolocation data in unprecedented times

The unique value of geolocation data in unprecedented times

When we launched Advan 5 years ago, we were really excited at the prospect of developing a new type of dataset. One that would give investors an alternative view into the companies and markets that they care about. We are data geeks at heart and we spent years agonizing over how to make our data more precise; manually drawing geofences around millions of locations, for thousands of companies. Normalizing data became almost an obsession.
3 minutes