 LOGIN
LOGIN

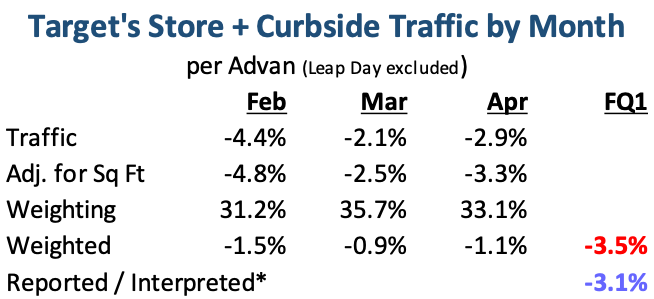
In contrast to the frequent press articles that Target’s foot traffic and sales were down mid-to-high single-digits due to consumer backlash over Target’s DEI policy changes, comp-transactions / traffic was down only -2.4%. Comp-sales for the stores were down -5.7%, which was partially offset by a +4.7% in digital sales (which is mainly store-delivery and curbside). As shown in the table below, February was the softest month per Advan traffic, and the period’s reported traffic* was largely in line with the Advan estimate. The average ticket amount declined -1.4% (roughly in line with Advan’s estimate). While management didn’t unpack the drivers of the ticket decline, we suspect it was due to fewer units in the basket, which is concerning . For example, household essentials (which is a consumables category) declined by -4% and that’s a frequency category where Amazon is making a lot of gains .
When we look at what consumer segments are behind the decline in visits during April. Advan + PersonalLive data shows that it’s affluent households, the same households in which Costco, Sam’s , Walmart and Amazon have gained meaningful market share. Within the sub-segments for Wealthy Suburban Families, Upper Suburban Families, and Ultra Wealthy Families, we do not see any divergent trends – they are down in line with the larger family, i.e. down 3 to 6%. These make up nearly 40% of visitors, but a larger percentage of sales given their affluence, like over 60%. That said, one also has to be careful in the conclusion here as these are the households that are more likely to be Target Circle 360 members and those using Target store-delivery. That business was up +35% in the quarter and so some of the decline shown above and below is the result of channel shift.
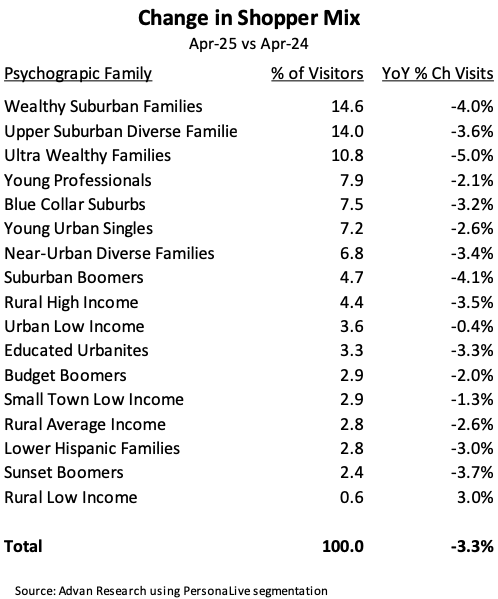
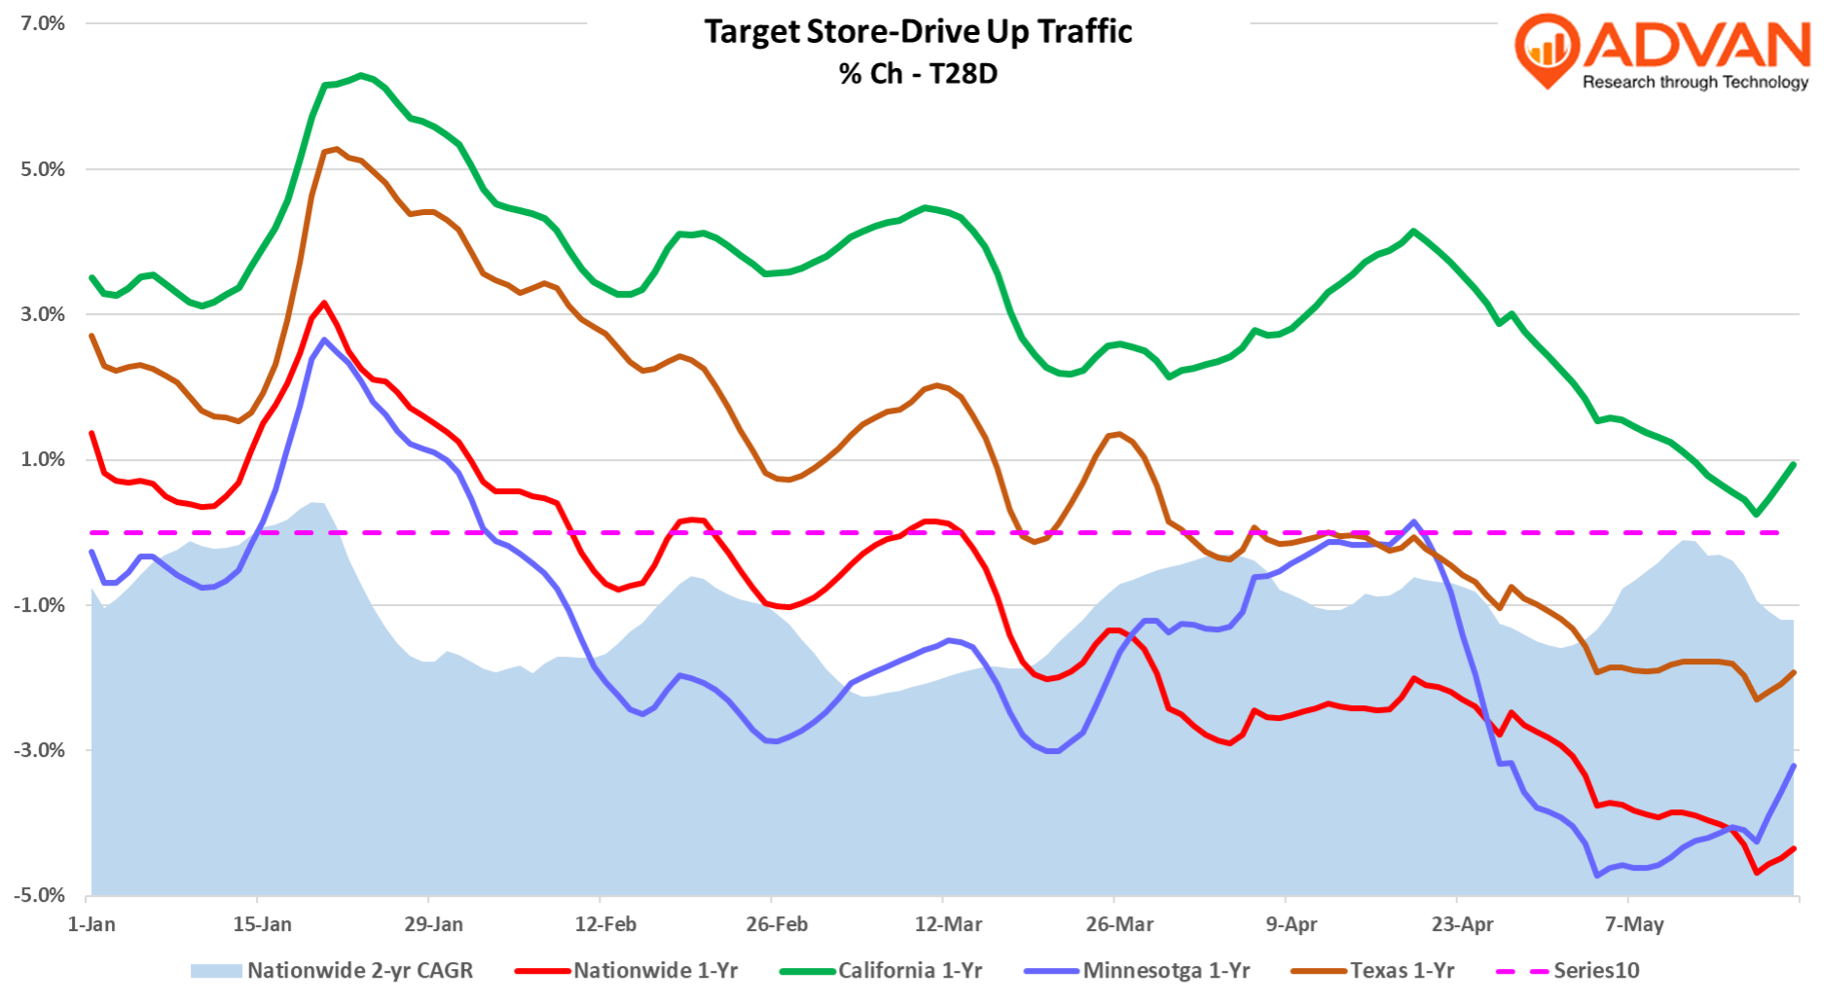
Given the “outperformance” by the other psychographic families and their subsets, we see little evidence that backlash was the driver of the weakness in store traffic. For example, “Solos,” which is part of the Young Urban Singles family, was down in line with the average of -3.3%. Solos are defined as “Heavily Hispanic, urban singles making low incomes. This segment primarily works in service and blue-collar jobs, often supplementing income as Uber and Lyft drivers. They watch ESPN Deportes, and Enrique Iglesias is one of their top influencers. They enjoy RuPaul’s Drag Race and regularly visit LGBTQ establishments. They hashtag #construction, #lit, #drink, and #fit.” We also find support for our conclusion that its competition (and value positioning) vs. backlash in the actions that Target announced today to remedy the decline in traffic. CEO Brian Cornell, “For the summer season, we’re offering more than 10,000 new items, starting at just $1. In the popular Bullseye’s Playground, we will continue offering items at $1, $3 and $5. And we’re expanding this assortment to include beauty items as well as trending snacks and beverages. And by July, we’ll shift to the critical back-to-school and college season, standing tall for value as we focus on supporting families during key life moments. We’re also finding new ways to move faster and operate differently given that uncertainty and the pace of change are higher than ever.“ Given the risk of higher prices resulting from tariffs, it’s imperative that Target improve its value positioning with consumers before more households shift their purchasing to Costco, Sam’s, and Walmart. As to Target’s plans for the medium- to longer-term, management made no update to what was articulated in early March. Lastly, management made no comments on any negative impact to sales and traffic from any sort of backlash. As the chart below demonstrates, nationwide traffic is currently -120bps below April’s rate. Moreover, some of Target’s largest markets have also mimicked the nationwide 1-year slump. As such, it wasn’t surprising that management lowered its outlook for the year. Cornell said, “In planning for the remainder of the year, we believe it’s prudent to expect that current top-line pressures will continue in the near term.”
* We take the reported store+curbside comp-traffic to be the reported comp-sales contribution from in-store and curbside (-4.5%) less the reported total company comp-ticket (-1.4%), or -3.1%.