 LOGIN
LOGIN

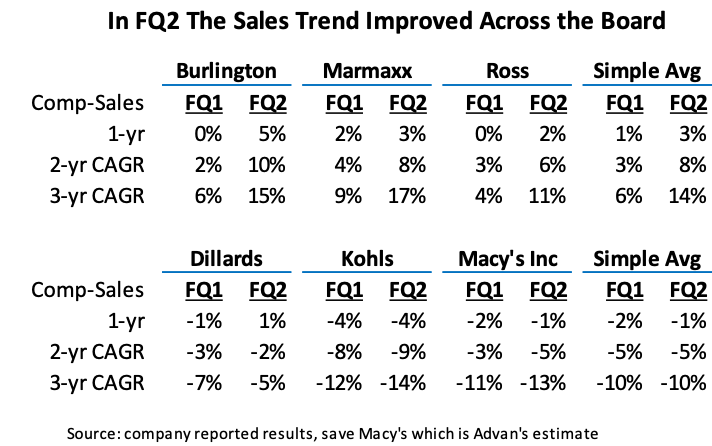
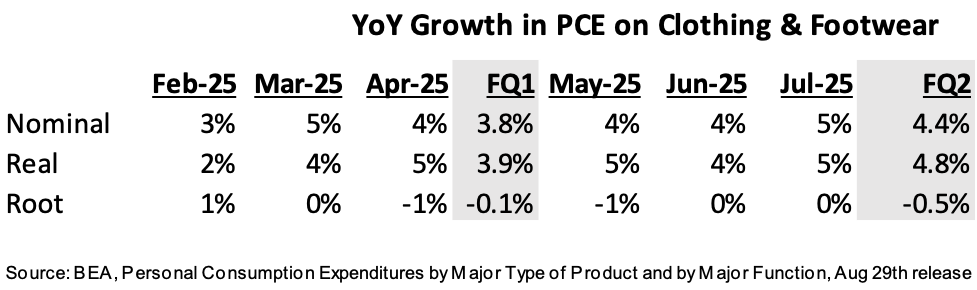
Fiscal Q2 results showed a markedly better pace of sales for off-price, led by Burlington (as we had previewed ). The gains were on a 1-, 2-, and 3- year basis as the table below demonstrates. Additionally, off-price’s acceleration wasn’t to the detriment of legacy department stores. If off-price was experiencing a big trade-down benefit, it would hit legacy department stores hard given that the three are 50% larger, in aggregate, than the legacy names. Big picture, the better trend also aligns with the better top line at the dollar stores, sneaker retail, and Walmart + Target , demonstrating further breadth and improving consumer. Confirming that is the second table which shows that PCE for the clothing & footwear category (which is the largest category for these retailers) was also stronger, both on a nominal- and real-basis.
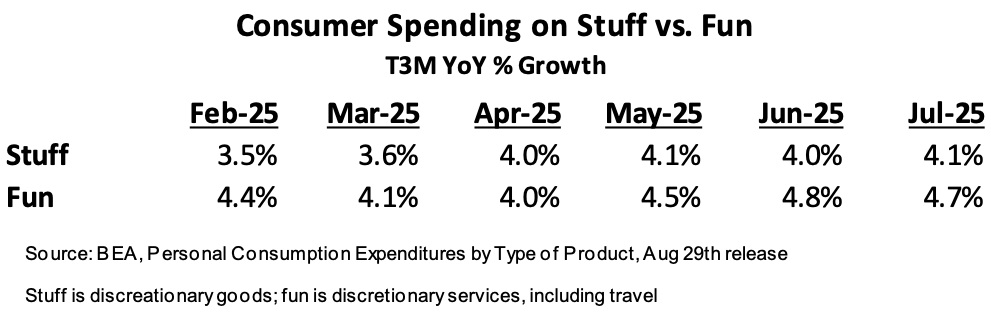
And it’s not just clothing & footwear, the table below demonstrates that consumer spending on all stuff also improved for the three-month period ending in July. (Stuff is our catchall phrase for discretionary goods.) While that’s a positive signal for Halloween and Christmas, it’s also a warning that the post back-to-school period could be a “pay-back” time and softer. We saw that in January and February as those months became pay-back time following an ebullient 2024 Christmas period.
Lastly, the strengthening spend on stuff wasn’t offset by less spending on “fun” as spending on “fun” also accelerated (we heard also heard that from the managements in leisure and hospitality during Q2 earnings). The take-away here is that overall consumer spending on discretionary has improved, and that the back-&-forth crowding out effect between stuff and fun that we’ve seen since the pandemic is low longer a big thing – Hurray!!!!.
In our preview , we commented that observed traffic for the June period was surprising soft for off-price, with our hypothesis being that the month was hindered by less new merchandise flow and lower in-stocks due to transitory factors stemming from “tariff discombobulation.” Across the board, managements noted “weather” hit June, but little more. However, Burlington’s CEO Michael O’Sullivan did said, “There are some merchandise categories, for example, decorative bedding, cookware and toys, but there are very few alternative sources of supply outside of China. In these merchandise categories, the interruption in imports in April and May **impacted inventory levels across the retail industry in the second quarter. **These categories were a drag on the sales trend in our home business during the quarter.”
On the quarter’s sales cadence, Ross’ CEO Jim Conroy said, “We are encouraged by the sequential improvement in sales trend relative to the first quarter, particularly the strength of our early back-to-school business in July… And towards the tail end of the second quarter, particularly in July, nearly everything was turning positive or was positive. Ross President Michael Hartshorn said on UPT, “If you looked at that, where we were very strong in May, dipped in June and then strong again in July,” – exactly the cadence that the preview’s dwell time analysis showed.
On the quarter cadence, Burlington’s O’Sullivan said, “The trend in Q2 started out slowly with the weather… being cooler than last year, but then our trend picked up in June and July as the weather normalized.” Advan’s data suggests that Burlington’s July was more driven by improvements in the conversion rate and UPT. By contrast, July’s improvement for **Marmaxx **and Ross was more of a traffic (and UPT) story. Improving the conversion rate is the outcome of “retail is detail.” O’Sullivan spoke about its progress on merchandising, in-stocks, store standards, and service levels. Burlington’s Q2 was driven by a +5% increase in comp-ticket, thus demonstrating strong results on merchandising. They didn’t split out the drivers between product mix, pricing, and UPTs; our sense is that all played a part. On standards and service, O’Sullivan said, “We’ve also been working very hard to improve the shopping experience. This starts with the standards that we set for ourselves, our store managers and our field teams. It also involves new systems, processes, tools and reports to drive consistency and efficiency. In the past year, we have seen the impact of these programs really start to take off. Our customer service scores are running at historical all-time highs, and we have seen improvements across all major operational metrics. Our store teams have really embraced these changes and our associate engagement levels have risen sharply. In addition, as I mentioned during our call in May, we have reimagined and redesigned our store layout, signage and fixturing. The objective of this redesign is to make our stores feel new and more exciting, easier to shop, more fun, more off-price and more Burlington 2.0. At this point, we have retrofitted about half of the chain to this new design. Customer feedback has been very positive, and we are seeing a nice sales lift in these stores. This lift helped drive our 5% comp growth in the second quarter.”
Lastly on the Hispanic and any potential trade-down benefit, Hartshorn said, “On trade down, we didn’t see a change in income cohorts. It was pretty broad-based in the quarter… During the quarter, stores that had a high concentration of Hispanic population underperformed the chain. That was especially true in June and especially in Southern California. The good news is we did see a bounce back in July.” TJX’s CEO also noted no particular trade-down dynamic.