 LOGIN
LOGIN

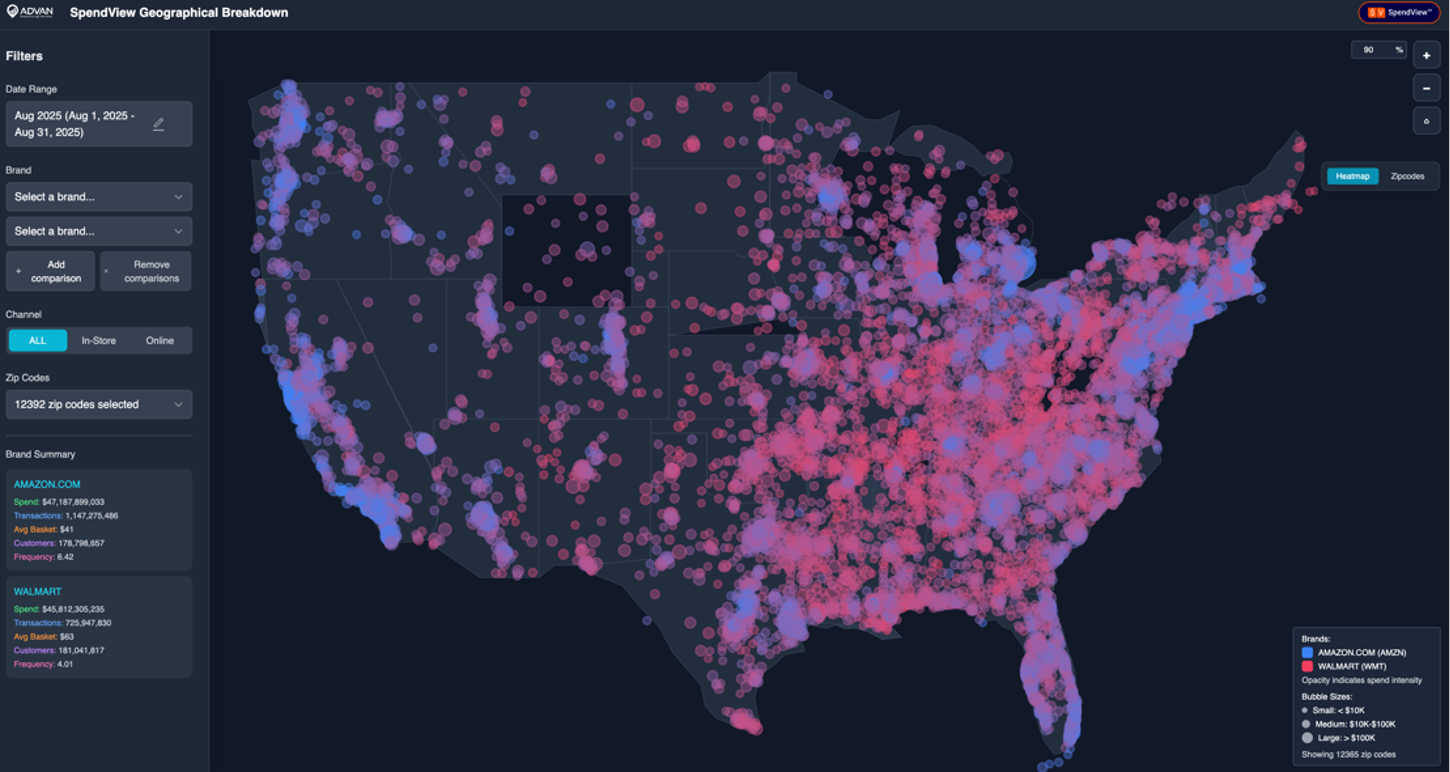
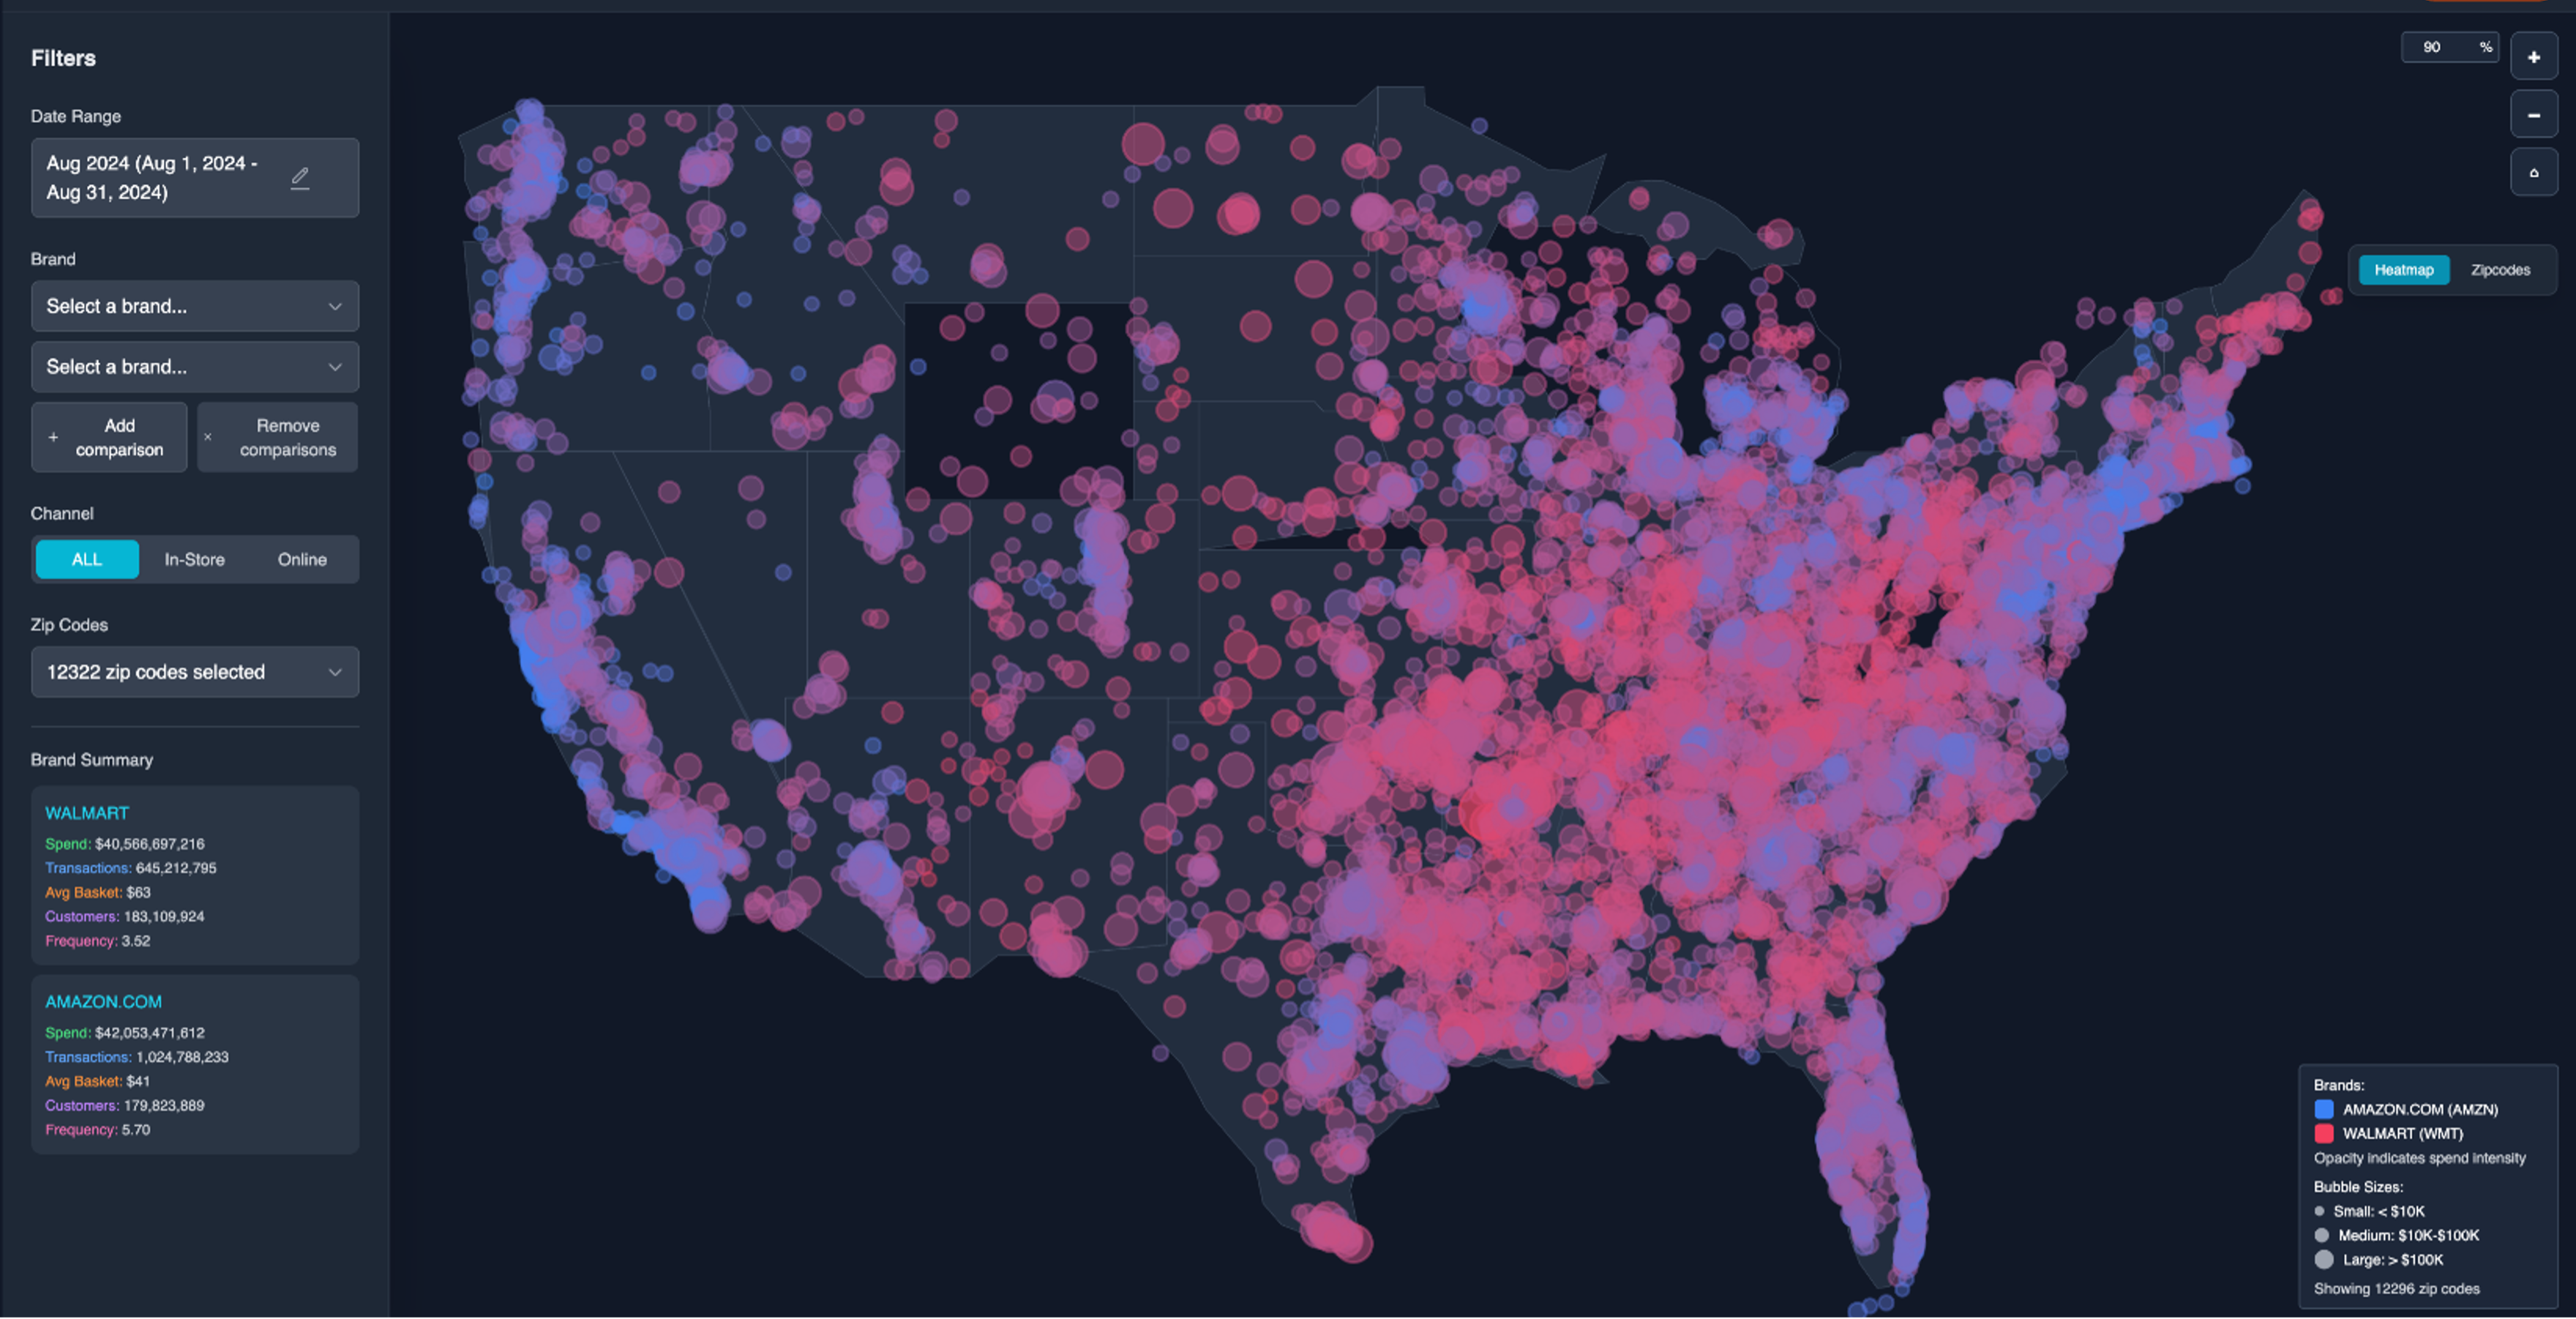
Advan has launched its SpendView™ geographic visualization product. This shows historical brand and location level, as well as consumer spending from a zip code / DMA / regional level (within where the spender lives). This is based on our panel of over 120M debit and credit cards. We then aggregate that spending by retailer brand and on- vs. off-line in terms of the utilized channel of a given brand. The charts below contrast Walmart and Amazon, August 2025 vs. August 2024, nationwide. The red dots are spend at / on Walmart and the blue dots are spend on Amazon. For Walmart’s fiscal Q2’25 we estimate gross spending at Walmart stores as $106B; it reported net $100B (also an estimate). The gross figure doesn’t include returns, which the net does; as such, the figures are aligned with one another. For the same period, SpendView™ shows Walmart stores + ecommerce spending increasing +6.3% and reported revenue increased +5.0%; the slight delta is likely due to the strong growth of third-party sellers. For Amazon’s Q2’25 the SpendView™ estimate is that consumer spending was around $138B; its financial results suggest around $140B in gross merchandise value and aligned with the SpendView™ figure. For the same period, SpendView™ shows spending increasing 10.2% and reported results suggested units sold growing +10%; again, the SpendView™ figures align well with reported results. For fiscal Q3’25 QTD, SpendView™ shows spending up about 7% YoY at Walmart and +12% at Amazon. Last week, we wrote that we estimate that Walmart was up +6% in August based on foot traffic. The Amazon figure is slightly higher than our going-in expectation, but aligned with Census’ monthly retail sales .
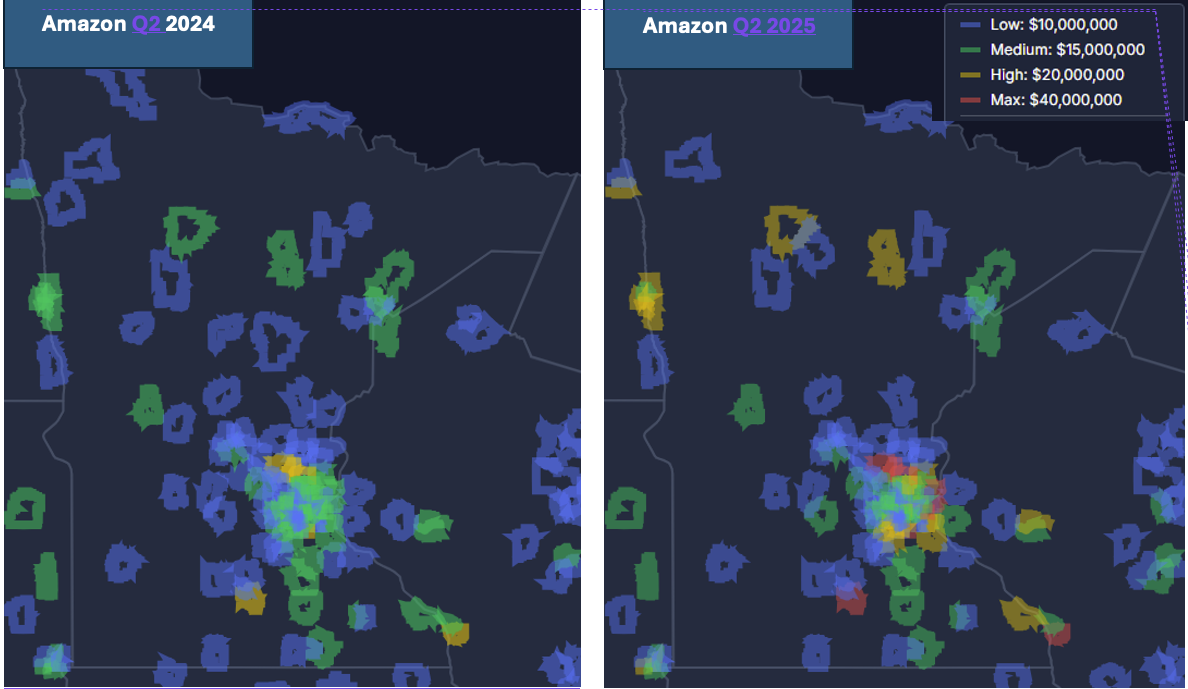
Amazon is driving double-digit $-volume growth in the US by making inroads into suburban and smaller market with same-day and next-day. SpendView™ allows us to see that dynamic for Minnesota. Shown below are the zip codes in Minnesota that rank in the top 10K for spend on Amazon. Many of the regions that were coded green in Q2’24 have moved in 2025 to the higher band (over $20M in quarterly spend). Many of 2024’s gold, have moved to red / max ($40M threshold).
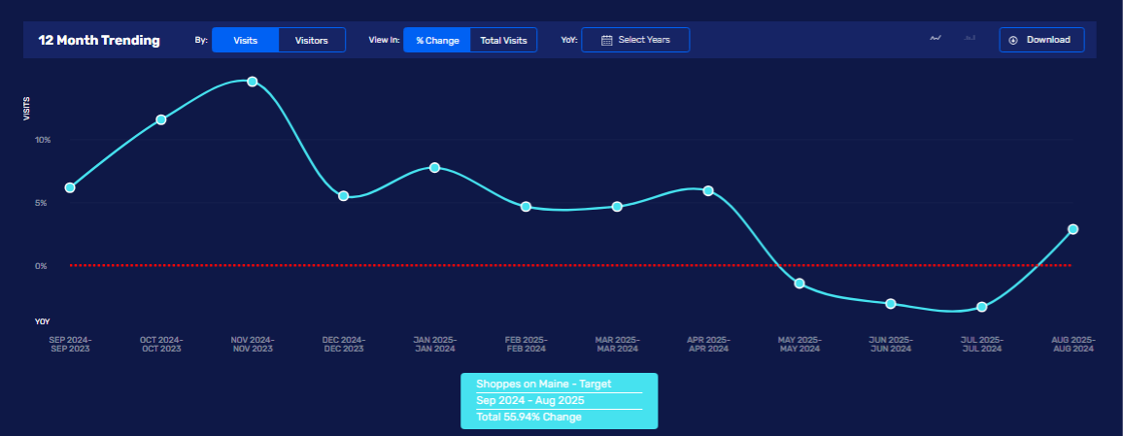
For Rochester, Minnesota – home of the Mayo Clinic (and lots of high doctor incomes), the spend on Amazon in Rochester’s zip codes 55901-06 increased to $48.6M in Q2’25 from $47.8M in Q2’24 (per SpendView™). While that’s an increase, it’s a small one. Impressively, incumbent Target saw spending increasing to $21.0M from $19.5M, or twice the $-volume as Amazon’s. Target’s largest increase was in zip code 55904, a +$450K increase (+8%). Advan’s observed visitation for the store in that zip code (Maine Ave), shows only a +2% increase in foot traffic for CQ2. This year’s weather in May and June in Rochester was abysmally cold and wet. That seems to have led Target shoppers to choose Target.com vs. traveling to the store, and showing off good performance again vs. Amazon. In fact, SpendView™ shows spending on Target.com in 55904 increased +17% for the quarter.