 LOGIN
LOGINOne of the largest moves we have ever seen in our data is that of gas station visitors and miles driven. Americans drive more now than they ever did, pre-pandemic and all.
What is the best way to trade this data? According to the analysis below, Gasoline Futures. This is the RBOB Gasoline front month index, on a year over year change basis, overlaid with Advan’s foot traffic at all US Gas Stations, also on a year over year basis.
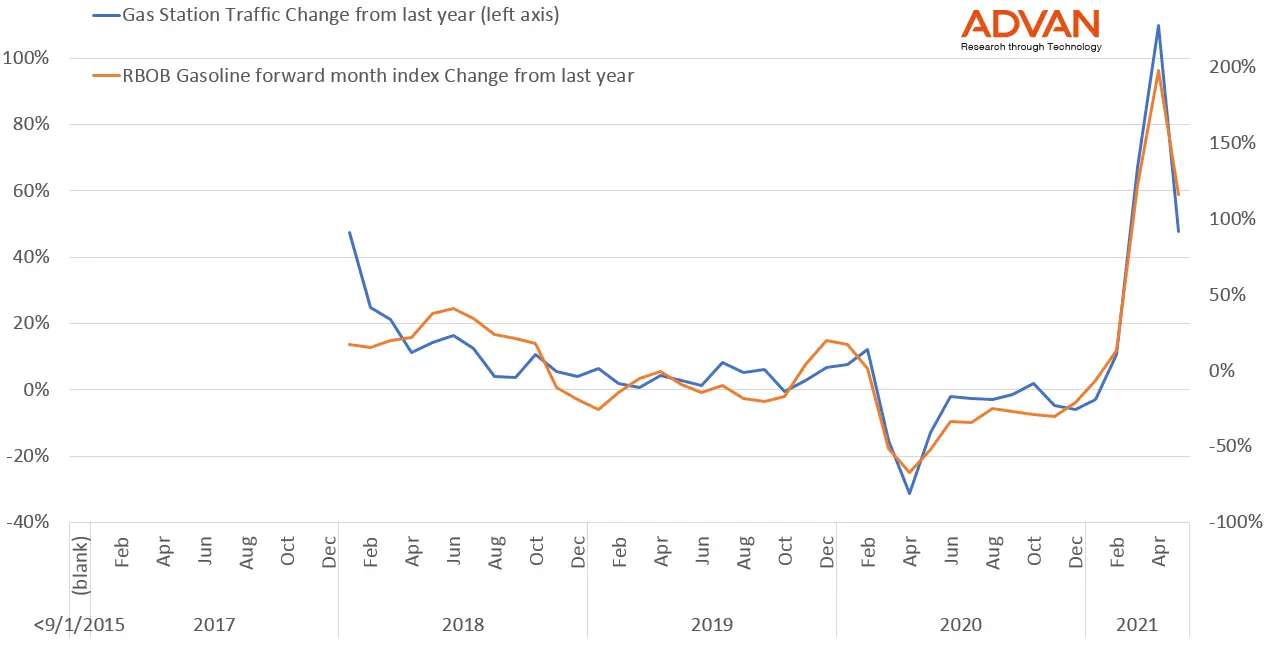
The futures move is actually even larger than the foot traffic. Here are the two lines graphed on the same axis:
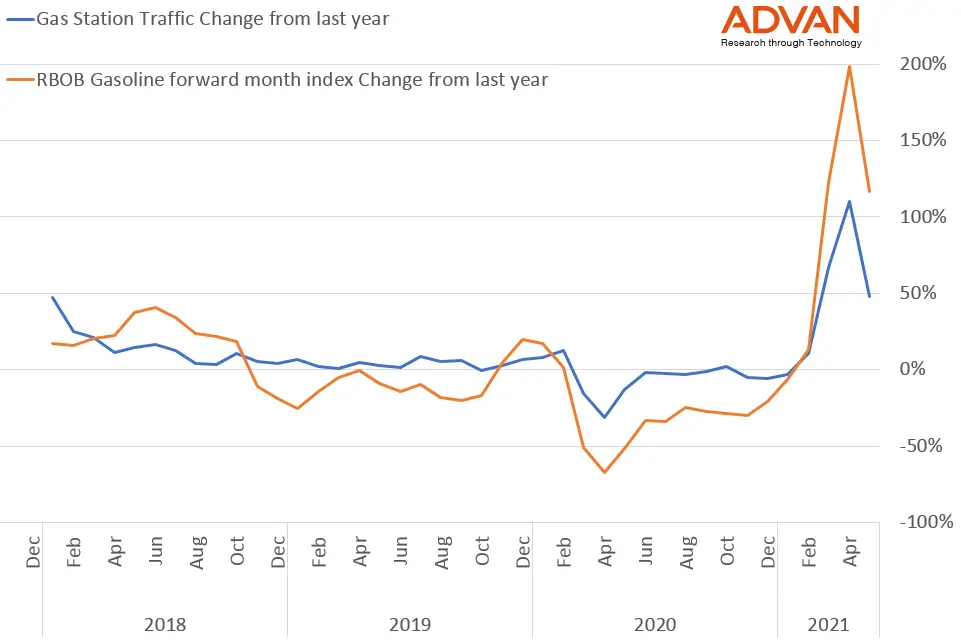
The correlation between Advan traffic and the Gasoline index is over 0.95 on a monthly and weekly Year over Year basis; over 0.9 on a one-week (year over year) forward basis, i.e., using traffic to forecast next week’s average RBOB; and over 0.8 on a one-day (year over year) forward basis, i.e., forecasting today’s RBOB open using yesterday’s traffic data (which is available before today’s open).