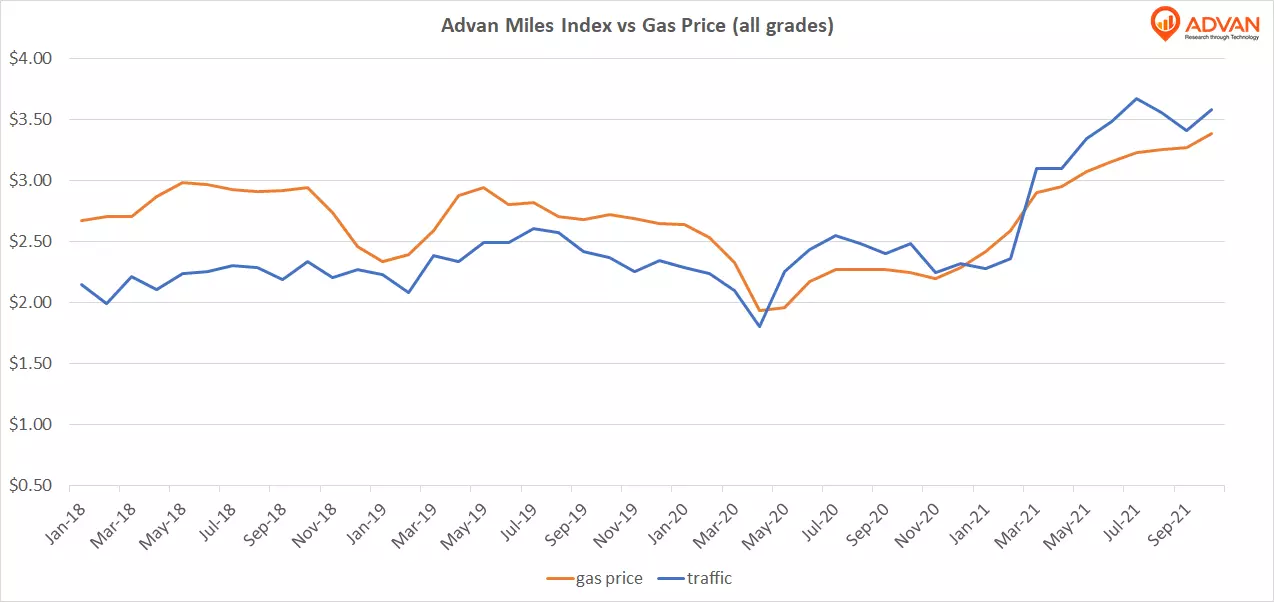
Advan has been flagging an unprecedented demand in gasoline as early as February 2021. Unsurprisingly, gasoline prices have been following traffic (ie demand) at the gas stations in lockstep, since we have started tracking gas station traffic in 2016.
The graph below shows gasoline prices overlaid with Advan Miles Driven index:

We can speculate about the reasons for the surge in demand: more people are driving to work instead of using mass transit; more are traveling by car instead of flying when possible; more are just not working or taking trips when they can; people moved out of city centers where they didn’t regularly use a car and are now driving for groceries, run errands etc. Some of these, such as migration out of city centers and lower airport traffic, can be verified with our data. But regardless of the reasons the result assively increased demand, despite increased costs at the pump.
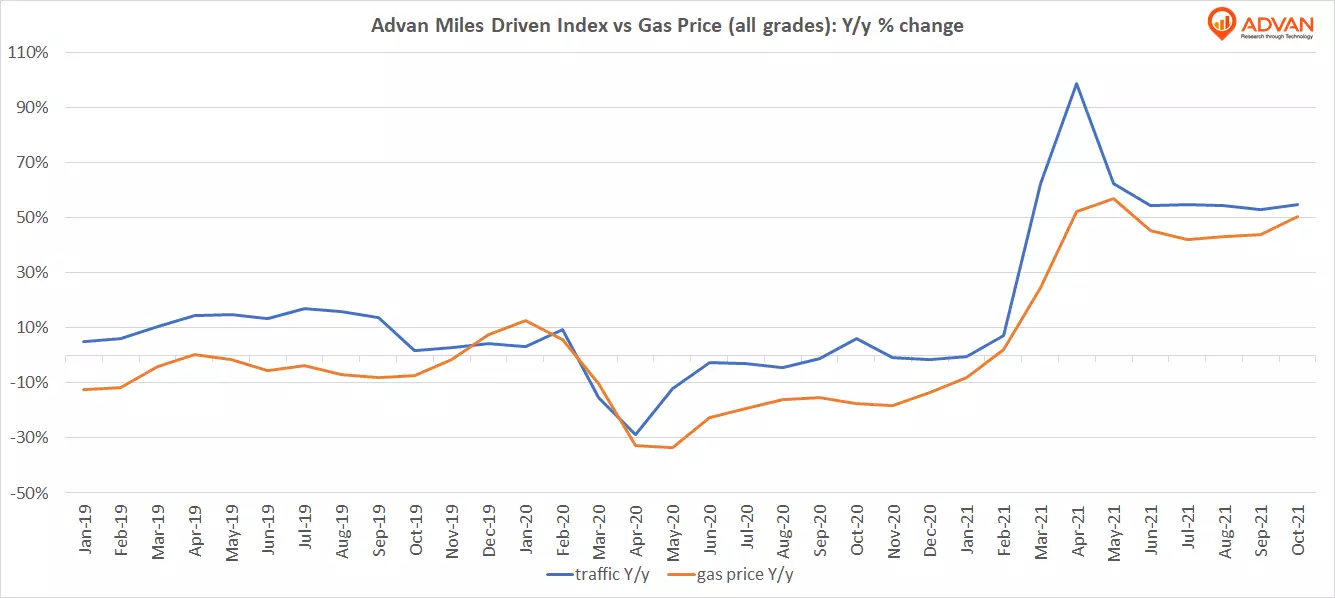
Below the Advan Miles Driven index and gas prices on a Y/y basis:

Advan tracks 300 indexes, measuring production and demand across all sectors, from chip, healthcare and car manufacturing to airport, port traffic and retail, hospitality, entertainment, banking, Reits and more, on a daily basis, worldwide.

 LOGIN
LOGIN