For investors, foot traffic data is fast becoming a critical weapon as part of an alternative data armory. The value of tracking real-time visitation numbers to retail and consumer-facing compa-nies is widely recognized. Yet, as we explore here, measuring traffic to industrial companies can offer even more effective signals to predict top line performance.
It is intuitive that the number of employees at production facilities should be an indicator of pro-duction, which in turn would help forecast revenues. But production tends to be a leading indica-tor. This means that the correlation between the number of employees at a facility, for example a factory, and revenue is not always visible when overlaying the two data series.
If instead we consider seasonality - and there are seasonal patterns to many consumer purchas-es - and compare the datasets on a year-over-year basis, we start to see much clearer correla-tions.
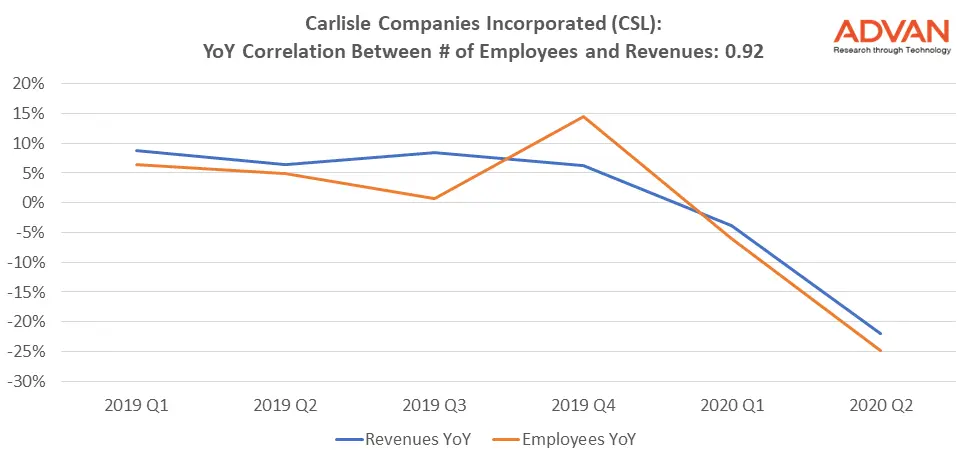
As an example, we looked at Carlisle Companies (NYSE:CSL), a $7 billion market cap manu-facturer of engineered products. As the chart below shows, we found a 0.92 correlation on a year-over-year basis between the number of employees at Carlisle’s facilities and the company’s top line revenue.

In the second fiscal quarter of 2020 analysts expected revenues of $988 million. Advan’s fore-cast based on foot traffic was $998 million, and actual revenue was $1.02 billion. The revenue number was 22% below the same quarter last year and the number of employees Advan meas-ured was down 24.8% during the same period. The stock closed at 122.65 on July 21st, before the announcement, and opened at 124.15 the next morning.
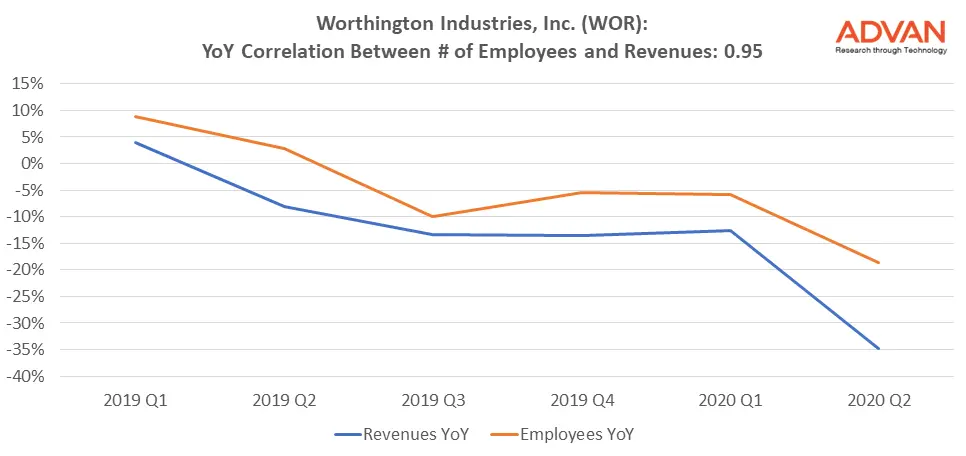
Next, we looked at Worthington Industries (NYSE: WOR), a metals manufacturer headquartered in Columbus, Ohio, with a market capitalization of approximately $2.2bn. For WOR, the average year-over-year correlation between the number of employees and company revenues was 0.95.
On September 23, the company announced an earnings miss. Company revenues were down 35% year-over-year with Advan employee foot traffic down 19%.

Join our webinar: Company and Sector Recovery Analysis - Thursday October 8, 2020 @ 12pm EDT.
For more information please contact info@advan.us

