Usually the first considerations when a company acquires another is how to realize economies of scale, cross-marketing opportunities, and areas of common improvement. If one knew which shoppers visit each location and quantified the cross-visits between malls then they could make educated decisions about which malls to focus on for improvements, tenant acquisition, or cross marketing.
With traditional measuring methods this is hard to achieve, but cellphone location data is the perfect fit for such an exercise.
But not all visitors are created equal. To get the true picture one needs to go a step further and adjust visits by the purchasing power of the visitors. Hence at Advan we computed the income of each device using its shopping behavior, and then adjusted the visits and cross-visits by income. Here are our findings.
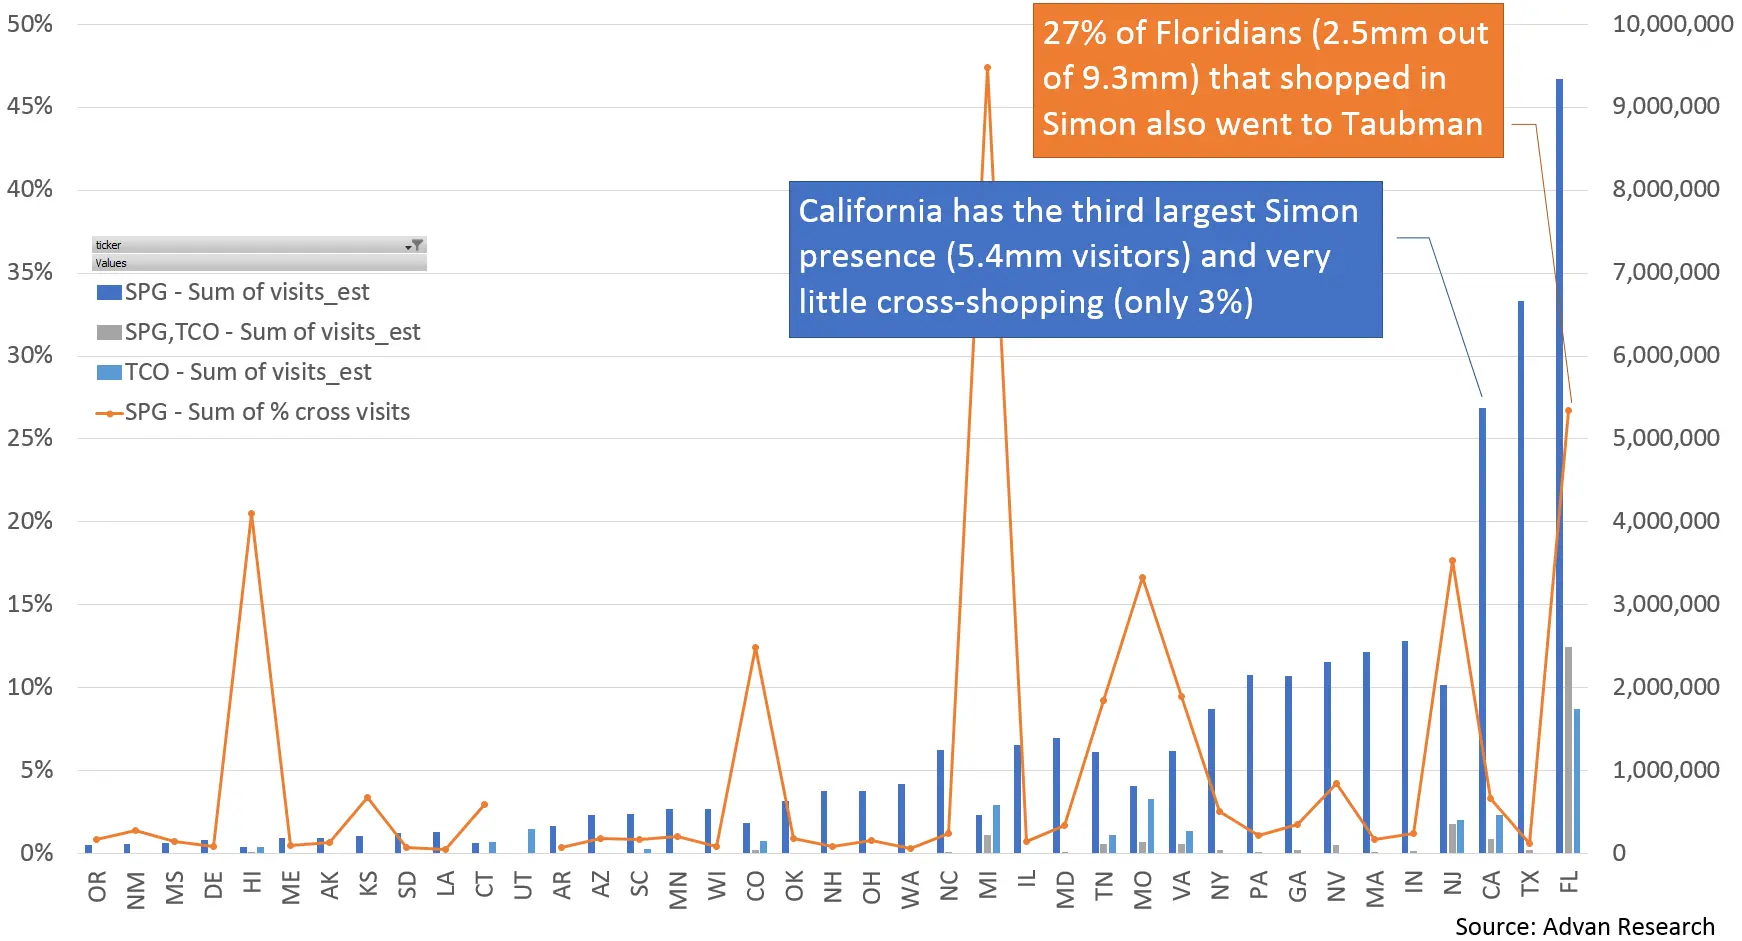
First, looking at traffic alone, here is the breakdown of traffic by state. Florida has the highest number of visitors for both Simon and Taubman, and the highest number of cross-visitors: 27% of Simon shoppers also visit a Taubman mall. California on the other hand (which is the next largest Simon state that has Taubman presence) only sees 3% cross-visits:

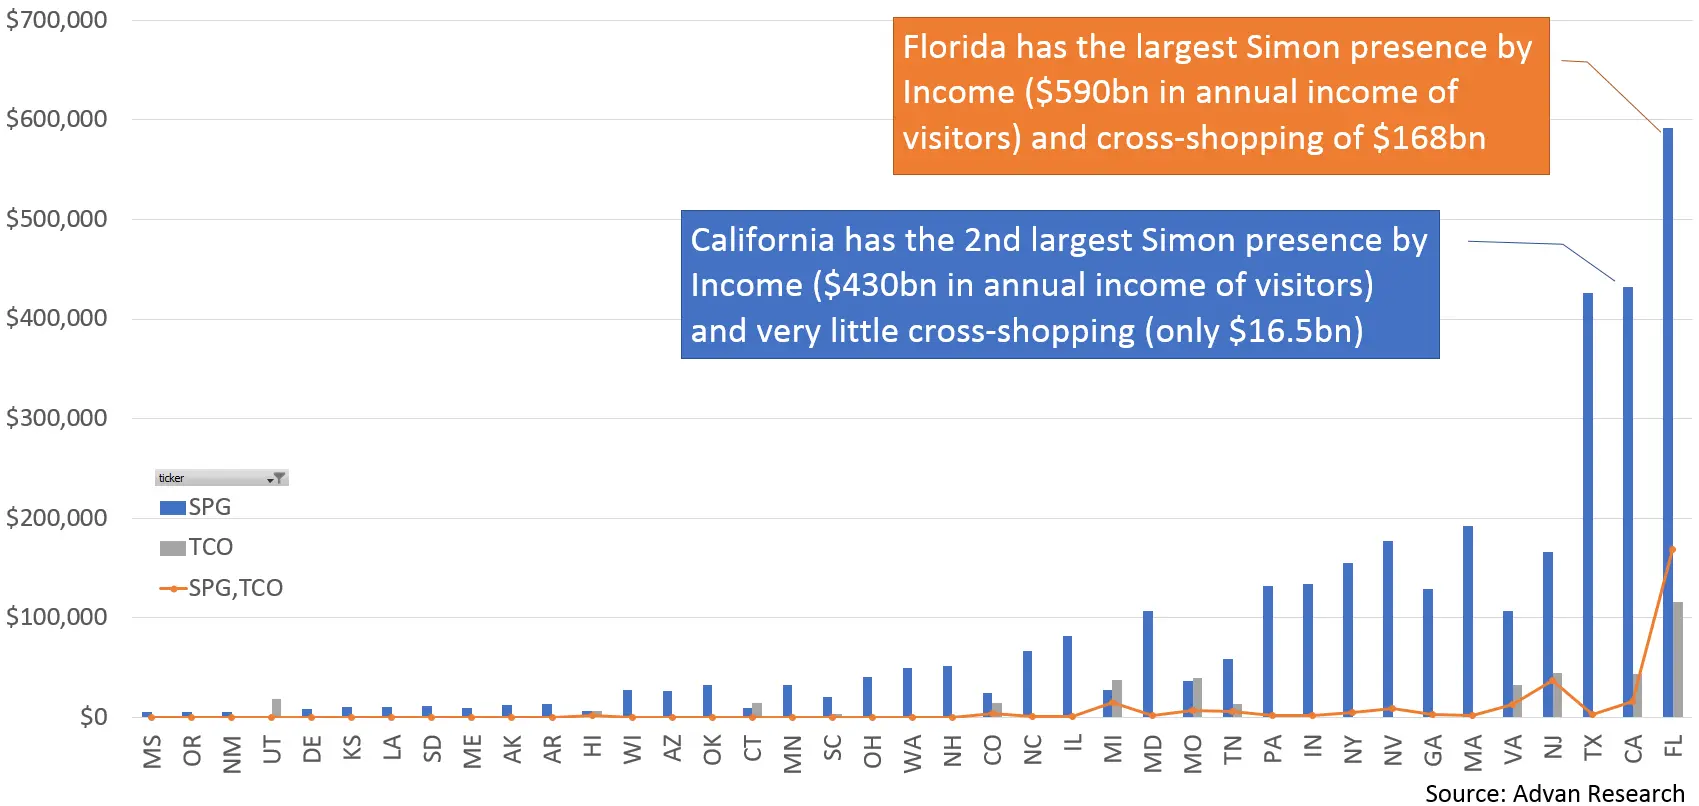
The picture is similar, but more informative, when taking into account the income of visitors. We see that Florida is still the largest state, with $590 billion of annual purchasing power across all visitors, of which 28% ($168bn) also visit Taubman, and California is now #2 in Simon presence at $430bn purchasing power with only $16.5bn of that cross-shopping at Taubman:

Of course the full details can be gleaned only when breaking down the above by individual mall, where one can identify which visitors, and which specific cohorts of visitors (high income/low income, millennials / baby boomers, etc) are visiting multiple locations, and make educated decisions on where to invest and how to expand the efficacy of each mall.

