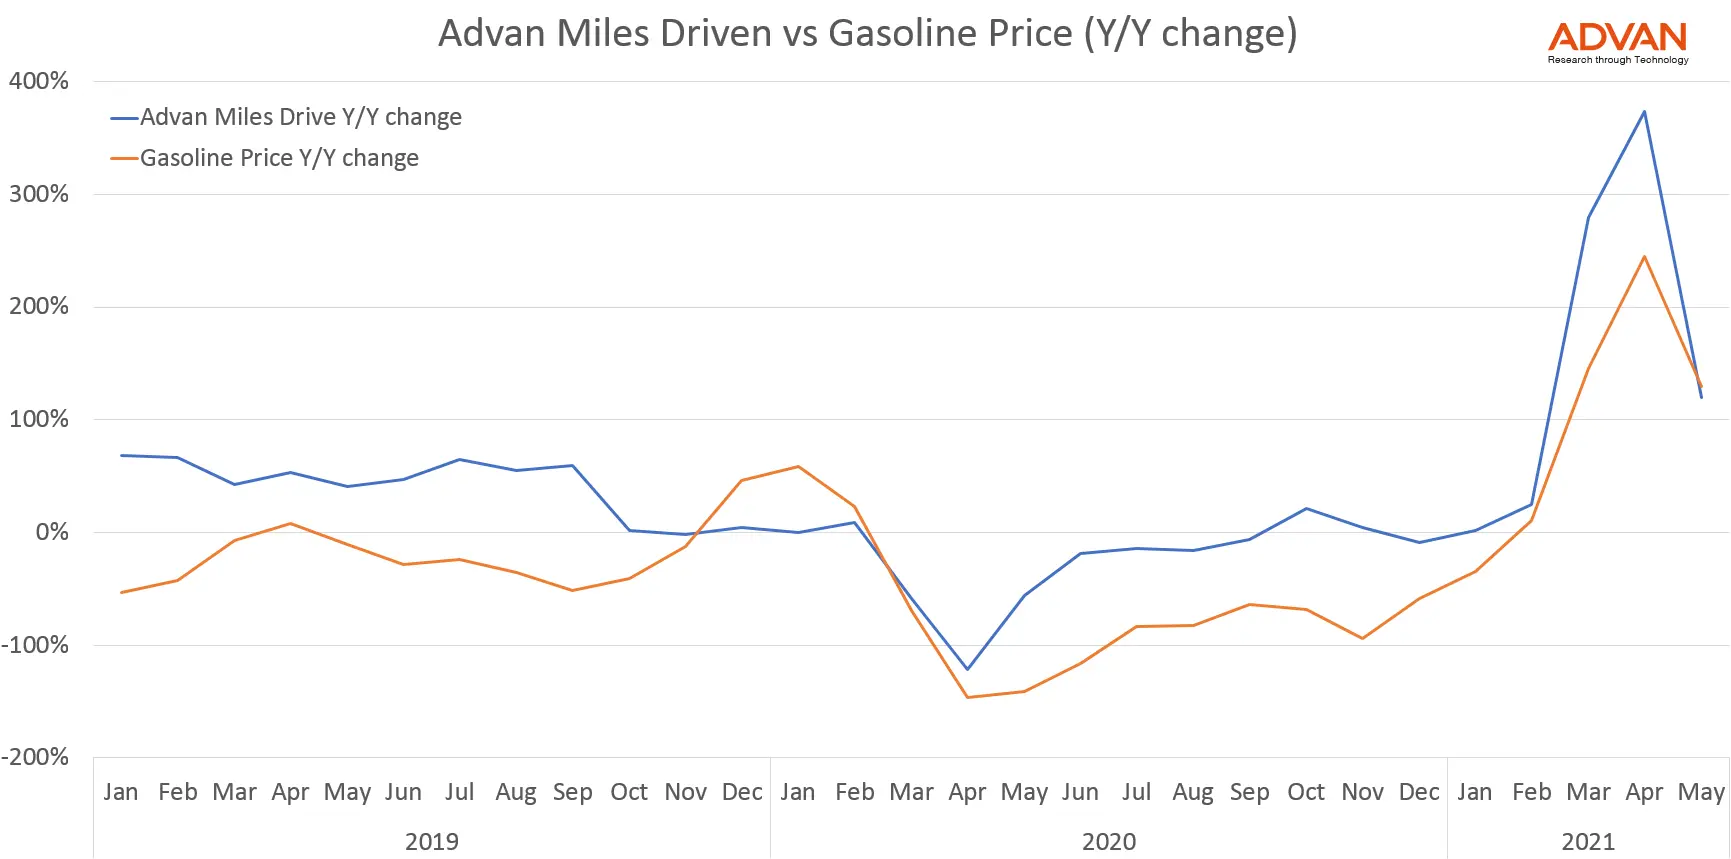
Gas prices and futures (contracts to buy gasoline at some point in the future) have been up massively over the last few months, to the extent that some traders are betting on the return of $100 oil/barrel before the end of the year (Options Traders Bet on Return of $100 Oil).
It was reasonable to expect that with US reopening after the pandemic we would see an increased demand in travel, and gasoline demand as a result. But the magnitude of the move is not seen for almost a decade – the last time oil price was at $100 was in 2014!
The move did not come as a surprise to some traders, however Advan’s daily updated miles driven index (shown in the figure below), measuring how many miles Americans drive, as well as the related trucks miles driven index, both of which show data as of the prior day (“T-1” in wall street parlance), have been forecasting the huge surge in demand ahead of the price actions. The index has a historical correlation of 0.85 with gasoline prices.

At Advan, we are computing foot traffic on over 300 sectors, and several of these key indexes are correlated between 0.8 and 0.95 with prices and federally published indicators.

