
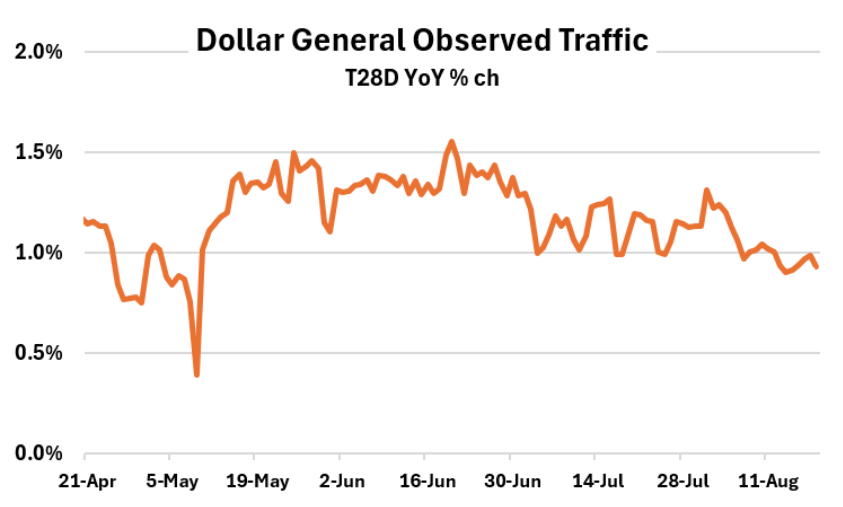
Dollar General’s consumer proposition as a nearby essentials-based retailer isolated it from the swoon in traffic across retail in May after gas prices spiked. Similarly, as gas prices eased, DG’s traffic didn’t react or lift. That indicates that DG’s proposition has remained consistent despite +/- on the macro. (See chart on next page.) CEO Todd Vasos did share that comps for June and July outpaced May’s.
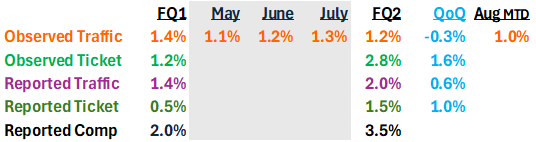
- Another proof point on the consistency theme is that FQ1 benefited from tax refunds and FQ2 was fully impacted by SNAP benefit reductions, and yet the pace of observed traffic* for FQ2 was largely in line with FQ1’s rate. Moreover, FQ2 reported comp-sales of +3.5%, leaving the 3-year comp CAGR (+2.2%) “consistent” with FQ1’s rate.
- Reported comp-traffic of +2.0% was above our observed figure (+1.2%), which we suspect stems from robust growth in its relatively new 3P delivery partnerships, which added +40bps to the comp. Additionally, we don’t observe 26% of its stores, which creates a less complete picture for Advan.
- On the DG consumer, Vasos said, “Any time it gets close to that $4 mark or crest $4, it puts an extra strain on the consumer. And we obviously have been there for the better part of Q2 and now as we move into Q3. So that consumer is under a lot of pressure. Our core consumer, especially as it relates to feeding her family and being there for her family needs us more than ever. And we're seeing that inside of our numbers as well. And then that trade-in because of all the pressure that, that middle and upper middle income consumer is under, and that is usually that $100,000-plus crowd, if you will, that has been trading in the better part of a year now and has continued to trade in through Q2 and now into Q3…”
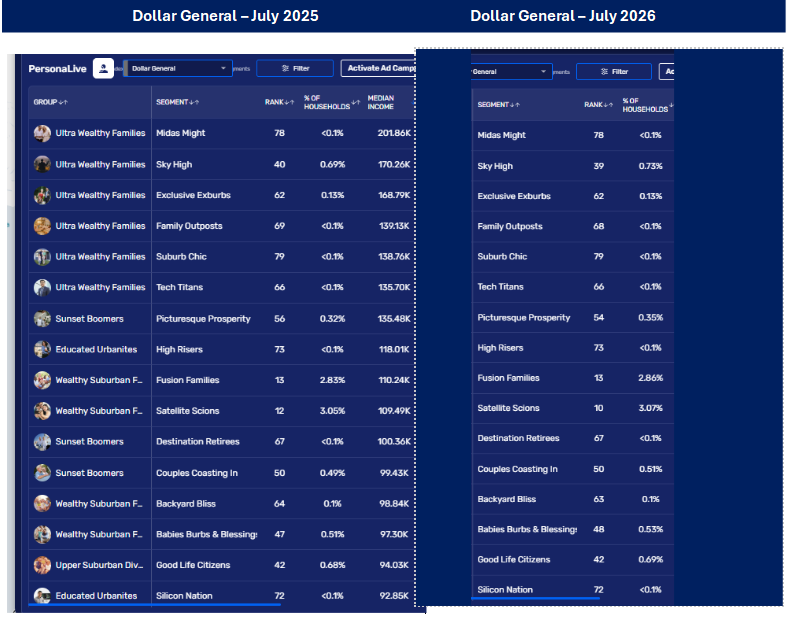
- Advan’s data shows a slight YoY increase in the median household income of the DG shopper, and the data panels on page 3 show which higher-income psychographic clusters are growing (July 2026 vs. July 2025) for DG; it’s quite a few. Moreover, increases are larger on a 2-yr basis.
- DG has also been tweaking its pricing and merchandise offering, and Walmart’s rollbacks created some uncertainty; however, average ticket (+1.5%) was stronger QoQ. That, along with the +46bps increase in the underlying gross margin rate, demonstrate successful merchandising / price positioning.
- Looking at performance between rural (70% of the business) and non-rural markets, the non-rural markets slightly outperformed (+23bps) rural markets. (Thank you, our Claude.ai+Advan MCP).
- Going one level deeper, rural-market stores with a Walmart (<2 miles) slightly outperformed (+8bps) those without a Walmart. That suggests that Walmart and its increased rollbacks have been less impactful to DG sales results and market share capture, evidence of its “consistent” proposition and retail execution.
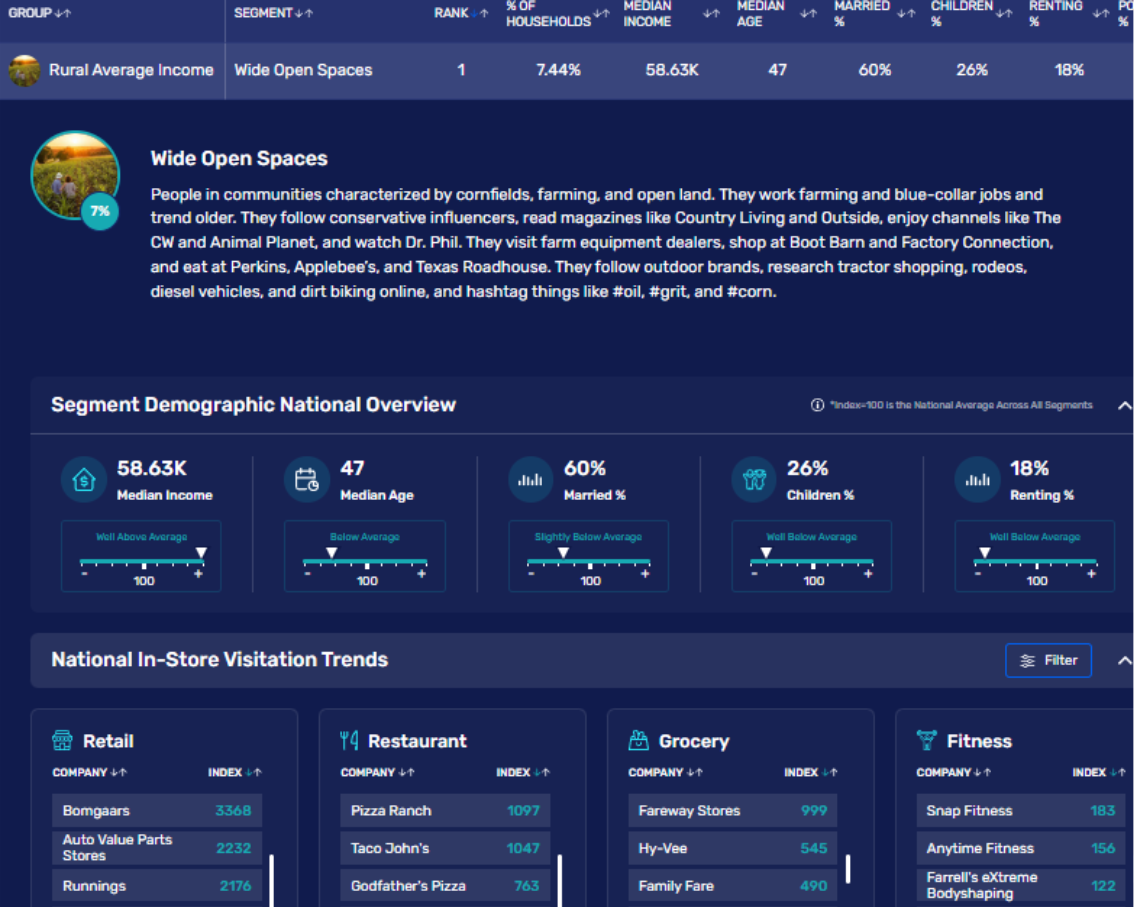
- Page 4 shows how DGs largest customer segments have changed over the past two years. Rural Average Income – Wide Open Spaces contributes 7.44% of DG’s visitors (7.4X the general population). We define Wide Open Spaces as “People in communities characterized by cornfields, farming, and open land. They work farming and blue-collar jobs and trend older. They follow conservative influencers, read magazines like Country Living and Outside, enjoy channels like The CW and Animal Planet, and watch Dr. Phil.” The Wide Open segment is down from 7.75% in July 2024; however, the visits by this cluster are roughly flat over the 2-year period. It’s down in share because the other segments have grown +3.3% in aggregate, supporting Vasos’ assertion that DG is growing in more affluent HHs.
* We only observe 74% of Dollar General’s locations
.png)