April 2, 2026
Categories:
Corporate & Supply Chain
Thomas Paulson
7 minute read

Previewing March Retail Sales – Dampened by Weather and Geopolitical Discombobulation

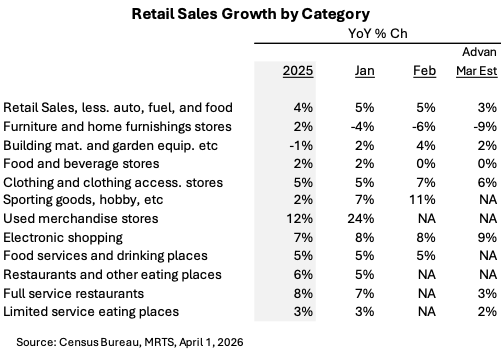
·    Retail sales growth in January and February was very strongper Census’ report. Per Advan, March was softer due to adverse weather andconcerns / impacts over Iran / oil.

·    Many of 2025’s notabletrends continue to dominate 2026 – including GLP’s impact on apparel, sportinggoods, grocery, and restaurants. Treasure hunt value (from Costco tosecondhand) is also strongly outperforming. In grocery, conventional grocersand conventional national packaged food brands continue to face challenges. Wesee little cause for relief to those challenges, especially if higher commoditycosts flow into the US food chain.  

·    Is March’s softer pacejust a bump, or is it the start of a trend? The 1H of April (after Easter) willtell.

The Census Bureau’s February monthly retail sales report, along with a positive revision for January, shows solid strength in consumer spending for the start of the year, as well as a continuation of heightened spend growth for two of 2025’s winners – apparel and secondhand. Apparel is in a “super-cycle” fueled by the uptake of GLP1s for weight loss, and secondhand is fueled by the vintage fashion rave and the K-shaped economy. (See our intro to 2026 here.)March’s activity stepped down from the strong Jan / Feb pace due to: adverse weather, the “CNN effect” of Iran / oil, the fall in equity markets, and growing consumer unease about employment and inflation. We see the weather impact in softer full-service restaurant visitation and an acceleration in fulfillment center activity (i.e. Amazon). Costco will report its March sales results in the coming week; Costco’s observed traffic was similar MoM, with any dampening from the weather being offset by strong visits to the fuel centers. That said, Costco’s traffic in California was similar MoM at +4.7%, and so, maybe its great treasure-hunt and deep value were similarly strong MoM. (Sam’straffic in California was +2.1% in March, slightly stronger than February’s +1.7%)

Delving into the retail categories of the report:

  • Furniture & home furnishings didn’t have a good month. One can also see that in RH’s outlook for fiscal Q1 sales -- negative 2-4% revenue growth. That, plus added expense, sent the stock down -22%.
  • Food & beverage stores (i.e. conventional grocers) is weaker due to share-of-stomach loss to mass / club / and Amazon (next day and same day on perishables). Walmart, and especially Walmart.com, had a very strong Feb / Mar period, which we suspect was driven by an acceleration in store-delivery of groceries (households stocking up and not wanting to visit stores in light of the cold and snowy conditions). We also see weaker scanner data (Nielsen), especially for national brands, and that reflects: (1) share-of-stomach loss to private label (mass / club) and (2) non-produce losing to produce (the good for you trend + GLP uptake).
  • The flip side of fewer bad calories consumed (GLPs) is slimmer bodies and that’s driving consumers into clothing stores and buying new wardrobes. We expect this apparel super-cycle to amplify in 2026 due to the pill format, lower prices, and significantly more advertising (by Eli Lilly, Novo Nordisk, Ro, Hims & Her). Just today, Eli Lilly’s oral - Orforglipron (now Foundayo), won FDA approval.
  • The GLP uptake also appears to be driving stronger growth in sporting goods retail (+11% in Feb). That said, as Dick’s Sporting Goods only projected a 2-4% comp-sales increase for F’26, we are a little suspicious of Census’ +11%. That said, Dick’s did have a very strong February. (March was back at January’s pace). And so, while we are suspicious of the magnitude of increase that Census is showing, directionally, we believe that the trend was much stronger in February. Nike’s results for the US (Dec – Feb) showed store sales declining -1%, but the wholesale business increasing a robust +11%, thus aligning with the stronger trend shown in the table. In February, observed spend at specialty running retailer Fleet Feet increased a very strong +14%.
  • Per used merchandise stores’ (secondhand) increase of +24% in January, all we can say is “wow!” (Maybe Grocery Outlet needs to put some of that Wow! in its stores. See our report on its store closures.)
  • Lastly, food service, Census’ February report doesn’t have the breakdown between full-service and limited-service. For March, Advan’s data shows that both categories are slower than January’s pace, with full-service more so. We suspect that both are slower due to higher gas prices and economic concerns. We suspect that full-service’s greater slump is due to the weather. The 1st half of April will provide the tell.

Our conclusions, the pace at discretionary retail during March is a step down from January / February’s very strong +5% pace.  GLP1s are providing a lot of tailwind to apparel and sporting goods retail. Brands and retailers need to get themselves on the right side of this very meaningful consumer trend as the impacts in 2026 will be larger than last year. Lastly, secondhand’s outsized growth is a signal that vintage and value are in high fashion. Brands and retailers can also play to that, but only in an authentic manner. One example - see what Levi’s is doing; observed spend on the brand was very strong in February / March.

See our last write-up on industry trends here.

Thomas Paulson

Thomas has been Head of Market Insights since January 2025. Previously, he served as Director of Research and Business Development at Placer.ai, where he was instrumental in providing actionable insights derived from location analytics and the path for expansion into new verticals. His extensive background also includes two decades as a buyside analyst and portfolio manager at Alliance Bernstein, Cornerstone, and others. Prior to that tenure he worked as an economist. Thomas also currently serves as the Co-Chair of the National Association for Business Economics Retail / Consumer Roundtable.