Key Points:
- Observed traffic (per Advan) accelerated in June following a slump in May; we suspect the upswing is broad and macro-related, but also driven by World Cup excitement and fan participation.
- Relatedly, Texas Roadhouse and Bloomin’ Brands Q2 results were better and investors chased the share prices higher. (Those that had been observing pre-prints didn’t need to chase.)
- Observed data shows progress by both in turning their tables faster and driving operational efficiencies, allowing them to invest back into marketing, value, and service levels.
- Restaurant distributors also reported better volumes, tracking the foot traffic, and both Sysco and US Foods provided favorable outlooks.
Q2 through July was a dynamic period for restaurant traffic. The spike in Gas Prices eventually led to a “pothole” during May; that was followed by a strong lift in June and July as the World Cup lit up summer activity. Additionally, gas prices and the Middle East didn’t significantly worsen, which seems to have produced an acceleration in consumer spending by the middle and the more-affluent across the spectrum of “fun and stuff.” Per the following chart, we suspect that the faster pace for FS-chains vs. independents is largely the World Cup.

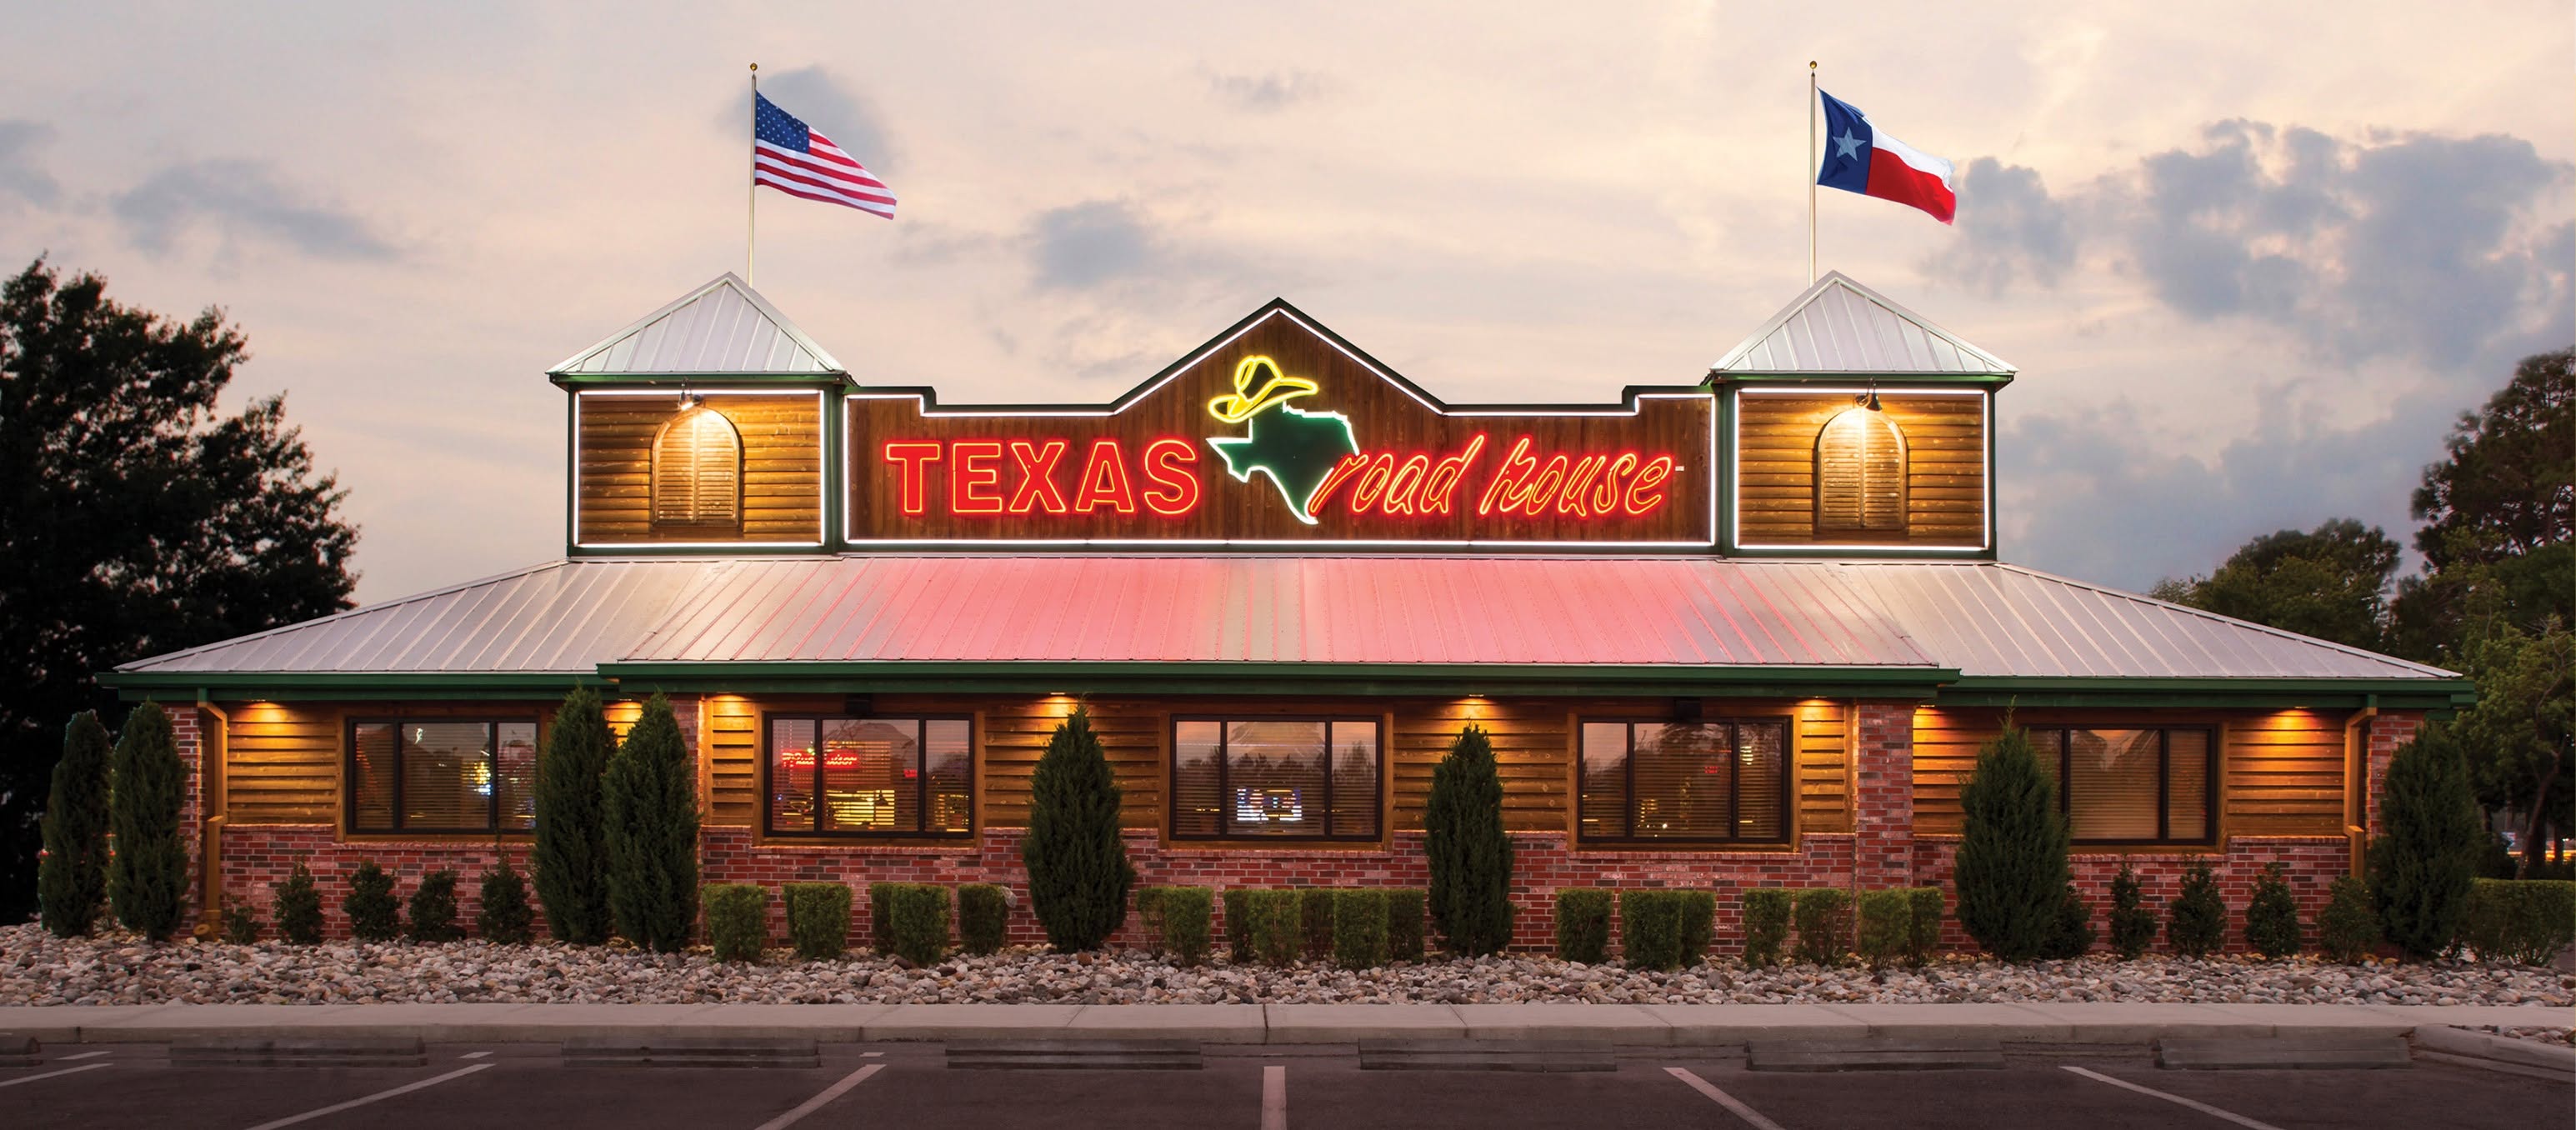
Texas Roadhouse reported solid comp-sales (+6.2% with traffic +3.0%). On its earnings call, Texas RH management noted relatively stable monthly comps* and while they did speak to July traffic (we observed traffic being +70bps stronger on the 4-5-4 calendar); management did note a pickup from the World Cup and mix turning positive (from negative). Operational efficiencies improved, as operating costs (labor, other operating) improved by 68bps YoY and as restaurant dwell time** fell YoY, thus demonstrating that they are turning the tables faster.
Bloomin’ Brands stock gapped up on results as comp-sales were better than feared*, margins climbed (productivity, pricing, and lower insurance expense), and as annual earnings guidance was raised. Outback (+1.4% with traffic -2.8%); better mix was also a positive, with more premium steak trade-up and stronger attachment of combos, toppers, sides, desserts, etc. Outback’s average check of +4.2% was just ahead of Texas Roadhouse’s +3.2%, which will once again lift its average check above Texas Roadhouse (now at +14%). (One dynamic that’s driving market share Texas RH’s way). Observed traffic was softer for July vs. June / Q2, which supports the low Q3 comp guidance of only +1-2% comps (for the consolidation of brands). Unlike Texas RH, dwell time was only flat YoY, suggesting no improvement in table turns.
However, on initiatives to improve service, CEO Mike Spanos said, “Craveable Service. As we have said previously, we identified that our 1 server to 6 table station ratio during peak hours didn't provide the right level of guest interaction and satisfaction. In Q2, we successfully rolled out our new service model to all Outbacks, reducing our ratio to 4 tables per server during peak hours. We are receiving positive guest feedback from this change.“
Given that averages hide nuance, and often it’s better to look at a distribution using venue-level data. Thankfully, we have the Advan + Claude.ai MCP to do the grunt work (we’ll focus in on Texas). For Texas the data is more favorable as 80% of Outback’s locations reduced their average dwell times, and by extension, the table turns increased. That said, there could be a mix component impacting the data as Texas underperformed the nationwide average in traffic and transactions. It’s also a market where they are closing locations (-5 YoY).

Turning to the results from restaurant distributors, for the Q2 period, we also see improved FS chain performance in the results of Sysco and US Foods. As shown in the table, independents / local outperformed by 490bps in Q1, which narrowed to only 170bps in Q2. This dynamic supports our data and viewpoint that the World Cup was a bigger lift for FS chains. Sysco CEO Kevin Hourican said, “Each month of the quarter was stronger than the prior with June being the strongest month* of the period on a 1- and 2-year basis.” (Which we read to be in line with our FS Independents index, observed activity (+50bps QoQ), and the boost from the World Cup.)
The very strong observed activity in July is vastly ahead of their F’27 guidance of +2.5% local case growth. On the cadence Hourican said, “The exit velocity of [CQ2] was strong. We're off to a good start in July. So quarter 1, period 1, off to a good start…”


Observed activity at US Food Group’s facilities shows a similar cadence to SYY’s with the May pothole that was followed by a strong lift in June and July as the World Cup lit up summer activity. On their results, CEO David Flitman said, “Within independent restaurants, our momentum is strengthening, supported by healthy new account growth and improved penetration with existing customers. This top-line momentum translated into strong financial performance.” As shown in the table, case-volume with independents accelerated for US Food (and decelerated for Sysco). Observed activity for our FS-Independents index accelerated +32bps QoQ. Given that US Food’s case-volume with independents outpaced that, indicating that it took more share during the period. Observed activity for our FS-Chains index accelerated +27ps QoQ. US Food reported that case-volume with chains declined a “less bad” -1.5% vs. Q1’s -2.3%, or +80bps QoQ; demonstrating that US Foods is no longer losing share in the segment. (Given that US Foods’ US restaurants business is only a third the size of Sysco’s, comparing % growth figures can be misleading).
On the market share gains, Flitman said, “Really excited about the net new account generation. It's continued to accelerate for the past several quarters. In fact, this quarter, … our net new account generation was as strong as it's been in 3 years. So really good momentum there. It continues to be the lifeblood of our growth... We continue to attract new sales talent to the company, feel really, really good, and I think we get an A+ for execution on this one.