Key points:
- Walmart’s store-delivery business continues to produce exceptional incremental growth (+45%), generally capturing affluent households along with their bigger basket sizes.
- As previewed, Target reported a much-improved top-line trend, but aggregate traffic has slowed for Target and many retailers due to softer spending by the less-affluent due to higher-for-longer gas prices.
- Target’s top-line results were much improved; however, the comps were easy + it’s early in recapturing its Tarjay, that leaves the 2H as a better period for assessing the progress. That said, the Advan+Claude data suggests that WMT+COST encroachment impact is less / or receding, which is the major positive from results.
- Advan+Claude observations also show strong results for Target’s 2025 new store and remodeling programs.
- Should you want to talk about any of this, send me an e-mail.
Advan is now on Claude (ChatGPT, Gemini, Copilot, and others as well) and I’m amazed at what detail it can drill into, and so, this analysis of Walmart’s and Target’s quarterly results will employ it. Separate from that, my overall takeaways from results are: (1) Walmart’s consistency points to ongoing strong execution that is generally offsetting a financially stressed lower-income consumer; a worsening K-Shape was apparent in Q4 results and with home improvement, and so there has been a widening of the K. (2) That widening is the result of higher-for-longer gas prices, which is impacting visitation and consumer spend (at the lower end), as shown below. And (3) Target is improving on its game, but more needs to be done on its Tarjay.
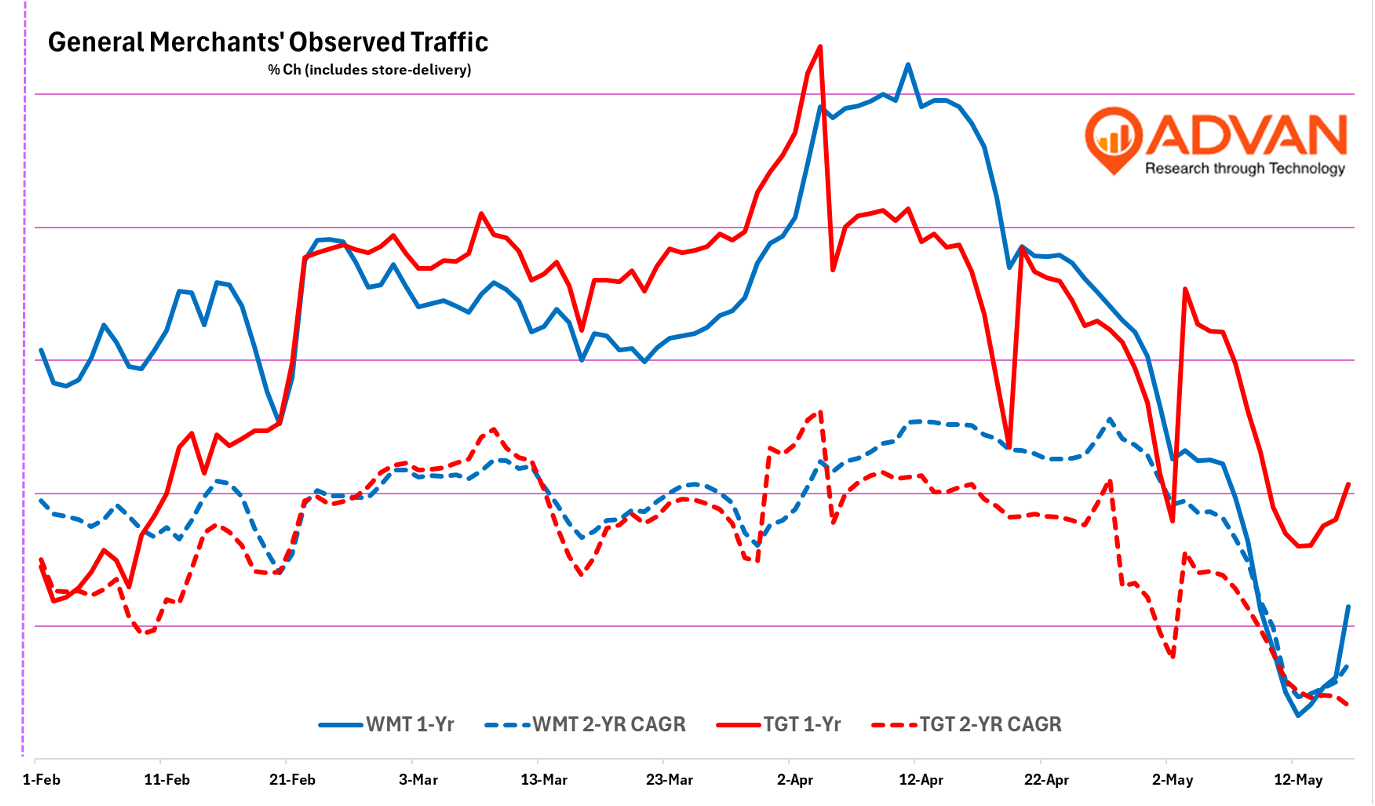
Walmart reported a +4.1% comp store increase and a +4.5% increase in merchandise sales, or +3.2% excluding fuel and the +1.1% increase in average ticket. The +3.2% increase was +60bps stronger QoQ and exactly aligned with the strengthening in Advan observed traffic (+60bps QoQ). Advan estimates that store-delivery added +450bps to the comp; assuming that the delivery is in batches of 2 orders, it would add 225bps to traffic.Overall reported comp-transactions increased +3.0%, but that includes a lot of business, including 3rd party marketplace sales (up +50%), advertising (+36%), and membership fees (+44%). Category-wise, grocery comp-sales increased +5%, general merchandise +5%, and health & wellness +2%. The lower rate in health & wellness comp-sales reflects the decrease in the price of popular generic drugs per the Administration’s policies (-700bps). The growth in general merchandise was nearly all inflation (+440bps).On the consumer, CFO John David Rainey said, “On the consumer, increasingly, it depends upon which consumer you're talking about. We see with our customers that the high-income customer is spending with confidence into many categories, while the lower income consumer is more budget conscious and perhaps navigating financial distress. And I'll give you an example, like we have a large fuel business, and we see that in the most recent period, the number of gallons that customers fill up with when they come to our fuel stations fell below 10 for the first time since 2022. That's an indication of stress.”
Store-delivery has been a strong ongoing driver of Walmart’s growth (it’s more than doubled in two-years). Using Florida as an example vis-à-vis Advan’s SpendViewTM transactions data, spending on Walmart during CQ1 increased +11% and nearly the rate observed for Amazon.com (+12%); however, spending on just Walmart.com (which includes store-delivery orders) increased +31% to reach 25% of total brand spending in Florida. We suspect that a lot of the $-growth for both Walmart and Amazon was in grocery, which has made Florida a more difficult market for conventional grocers (see Publix’s and Ahold’s recent results). Also importantly, it’s the more affluent consumer that pays for the convenience of store-deliver, and its those that are driving the +31% growth. Yet, the strength in deliver, visits to Walmart stores (in Florida) show consistent growth across all income segments. That demonstrates that the convenience offering is adding incremental business and consumption occasions to Walmart’s business. That’s what’s eating into the grocery conventional channel (one of our large themes).

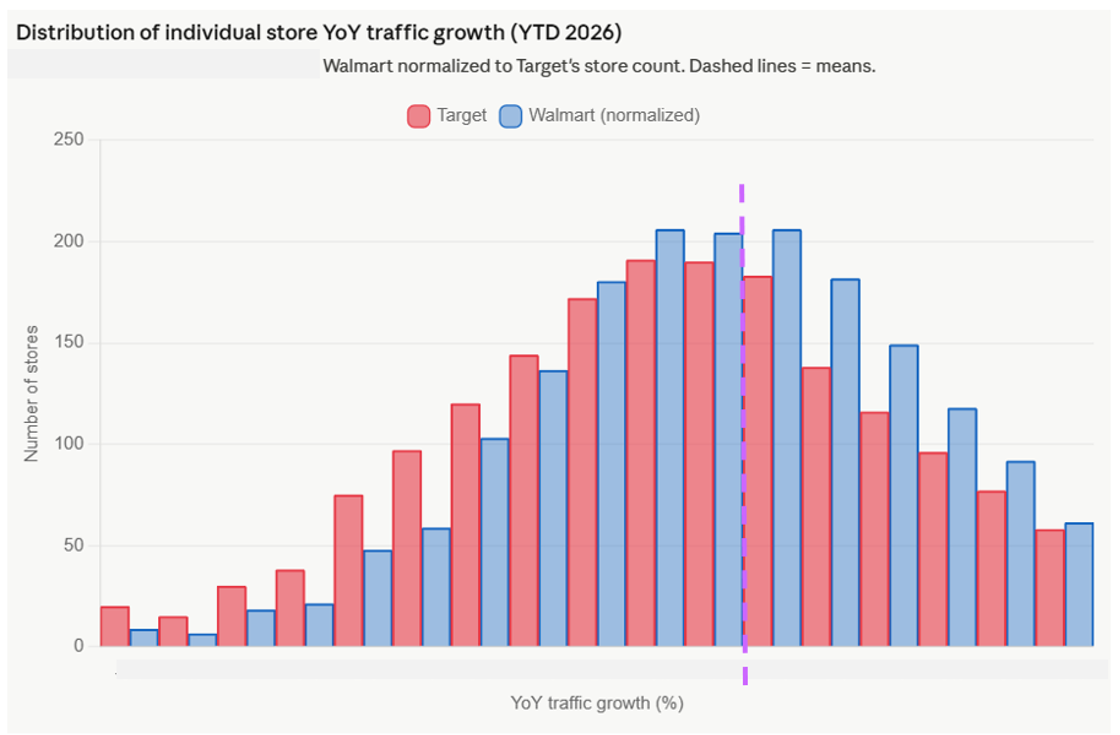
In terms of Advan+Claude observations, counter to some narratives, Walmart’s traffic in smaller markets outpaced growth in urban markets; on a quintile basis, the delta was 150bps. In terms of distribution of growth of the individual stores, Walmart has a lower standard deviation than Target with the std-dev / average being 0.99; whereas Target’s is 1.24. Walmart also has a more positive skew. Additionally, looking at comp-traffic consistency, the standard deviation of traffic narrowed QoQ for Walmart. (Thus there are two vectors of improvement for Target, fewer low performing stores, and more consistency across the portfolio.)

Turning to Target, comp store sales increased +5.6%. Disaggregated, store-only comp-sales increased +4.7% and Dot.com comp-sales increased +8.3%. The 2-yr comp CAGR improved a lot, the 3-yr, good improvement, and the 4-yr, by +110bps. The store-only comp accelerated by 8.6% ppt QoQ and the 2- and 3-yr comp CAGRs all improved. Contributing to the store-only comp was a +3.6% increase in comp-traffic and a +1.1% increase in comp-ticket. Per Advan observed, traffic per location increased +4.7%, the average transaction size increased +0.9%, and +5.6% combined. Category-wise, hardlines (including toys and collectibles) grew +15% -- Yes! Five Below is going to have a blow-out quarter. (See our note on March retail sales and our presentation to UBS clients on the fiscal period.) All the other categories also improved, but the more-Tarjay categories Apparel (+3.6%) and home furnishings (+0.6%) produced modest growth, implying that more Tarjay is needed in these categories. Target’s traffic in smaller markets also outpaced growth in urban markets, on a quintile basis, the delta was 240 bps.

Incoming Chief Merchandise Officer Cara Sylvester said, “We're celebrating the trends that shape culture to create buzzworthy assortments and experiences exclusive to Target. So far this year, we've offered three such partnerships that far exceeded our aspirations. I'll start with our Q1 drops from Parke and Roller Rabbit. With social engagement significantly exceeding prior collaborations and some of the strongest launch week sales we've ever seen from our limited-time offerings, these partnerships show that when we combine great product with cultural relevance, we create moments that drive traffic, engagement and excitement for our brand. And for fans of all ages, our Only-at-Target cross-category Pokémon collaboration helped to position Target at the center of one of the most powerful global franchises. The launch earlier this month set sales and social media engagement records for us, and we're excited about another drop taking place later this quarter. These examples show how we're focusing on style, design and culture to lead with merchandising authority.”Sylvester, “In home, we're beginning a multiyear reinvention. We'll make significant edits to decorative accessories this quarter, changing out nearly 3/4 of this assortment. Later this year, we'll introduce that same level of change to kids' home and bedding categories as we continue to clarify our offerings and value proposition in these ever-important style categories. We have plans to continue this journey with additional home categories like kitchen and storage in 2027.”
Longtime readers will recall that we view Target’s challenge to be more of significant competitive encroachment (Costco, Walmart, Sam’s, and Amazon), rather than not enough Tarjay. Advan+Claude allows us to explore how Target is faring relative to the encroachment. Target has 253 locations with a Costco within one mile of it. These 253 locations outperformed the chainwide average by +140bps (on a 2-yr basis the outperformance was +176bps). For locations with a Walmart within 1-mile (705 locations), the outperformance as a more modest +90bps. As such, the data suggests that the encroachment impact is less / or receding, which is a major positive from the results.
On new stores, Chief Operating Officer, Lisa Roath said, “In Q1, we opened 7 new stores, including our 2,000th location, and we remain on track to open more than 30 this year. We're energized not only by the financial strength these openings bring, but by the meaningful impact they have in the communities we serve, expanding access to our incredible value and assortment, creating jobs and bringing us closer to more guests, giving us additional opportunities to invest our time, resources and support as the new neighbor in town. Beyond these stores, we're also scaling our remodel program with over 100 projects already underway, including an enhanced focus on food and frequency-driving categories where we're seeing the strongest returns.“
Advan+Claude observations puts the new “2025-vintage stores are running about 7.3% below chainwide on a per-store basis (~78.5K visits/month vs ~84.7K). That's a fairly small drag and consistent with the typical new-store ramp.” We agree. In terms of remodels and Advan+Claude observations, “The cohort is +6.6% above its H2 2024 level while the chainwide same-store comp is basically flat (+0.1%). That ~6.5-point gap is consistent with a real post-remodel lift on the stores that show the clearest remodel signature.”