
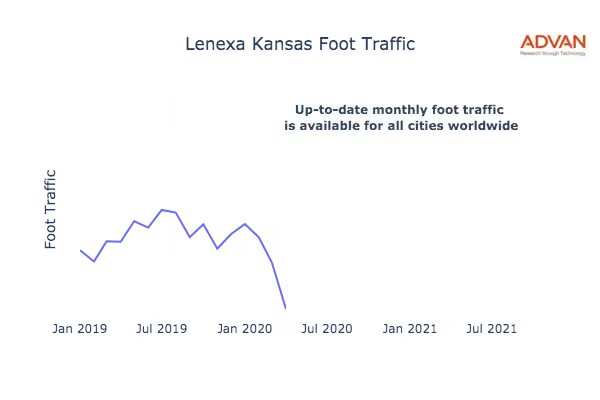
Up-to-date monthly foot traffic is available for all cities worldwide.
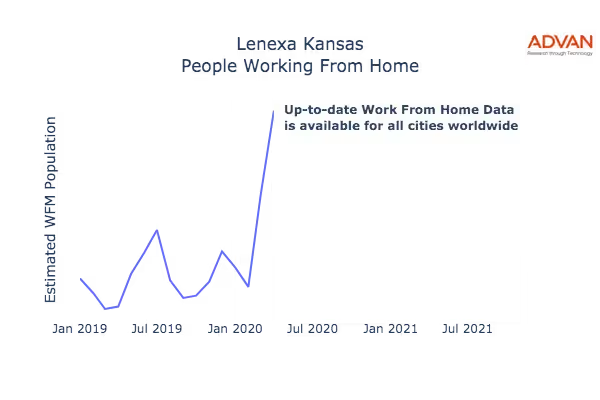
Up-to-date work from home data is available for all cities worldwide.
Additional reports are available for the city residents, employees and tourists.
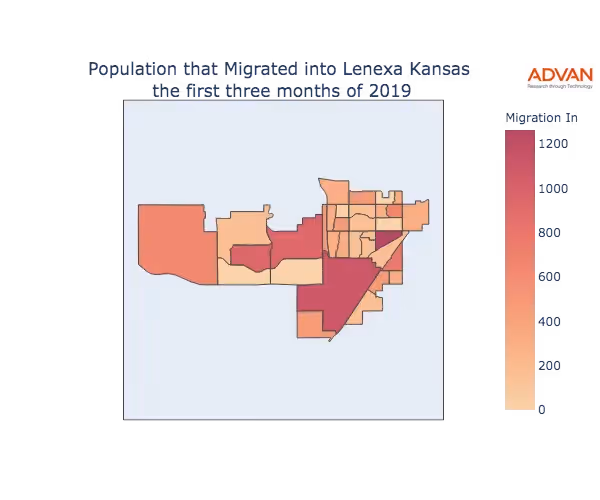
Up-to-date migration is available for all cities worldwide.
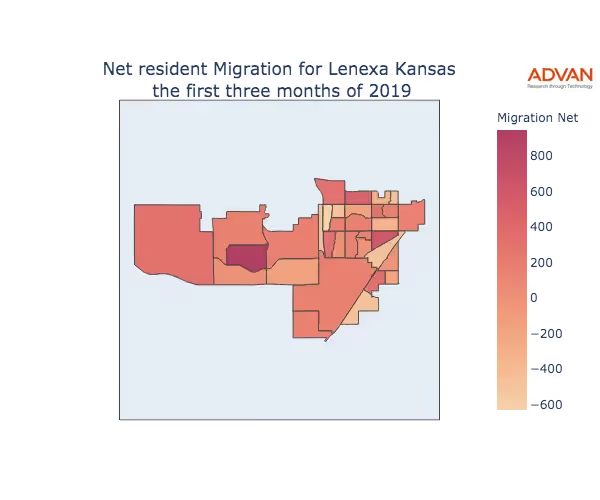
Up-to-date migration is available for all cities worldwide.
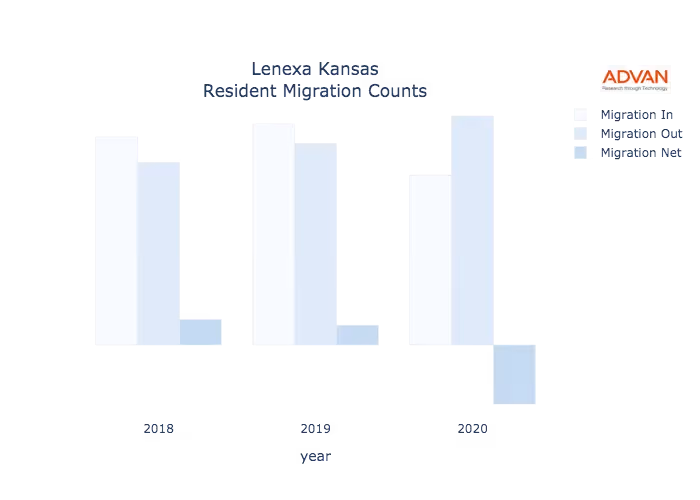
ADVAN measures the inbound, outbound and net migration to the city of Colorado Springs Colorado for the years 2015, 2016, 2017, 2018, 2019, 2020, 2021, 2022 and 2023. Data displayed on the charts above are annually aggregated but using our product REPerspectives, it can be analyzed with monthly granularity by State, Zip, County and Census Block Group. Additional reports are available for the city residents, employees and tourists.