The coronavirus pandemic that is reverberating across the country and the globe has impacted commercial real estate in ways unforeseen from previous “black swan” events. This impact has not been even across sectors or markets or even subsectors within a property type. Fortunately, with today’s technology and analytics we are able assess some of the impact as it is happening rather than waiting in arrears for the data. Using data from Advan that tracks anonymized cell phone movement over time, Eigen10 Advisors examined the change in foot traffic at a sample of different types of retail centers in different markets.
For the purpose of this analysis we compared a prime “non-essential1” retail location and a prime “essential” retail location in each of three different markets to see how the number of people visiting those locations changed in February and the first two weeks of March compared to a year ago. The first market we examined was Seattle since that is where the first Covid-19 case in the U.S. was identified and unfortunately, where the first fatalities occurred. The other two markets included in the analysis are New York, where the second large outbreak occurred a few weeks after Seattle, and Dallas which hasn’t been a significant hotspot yet.
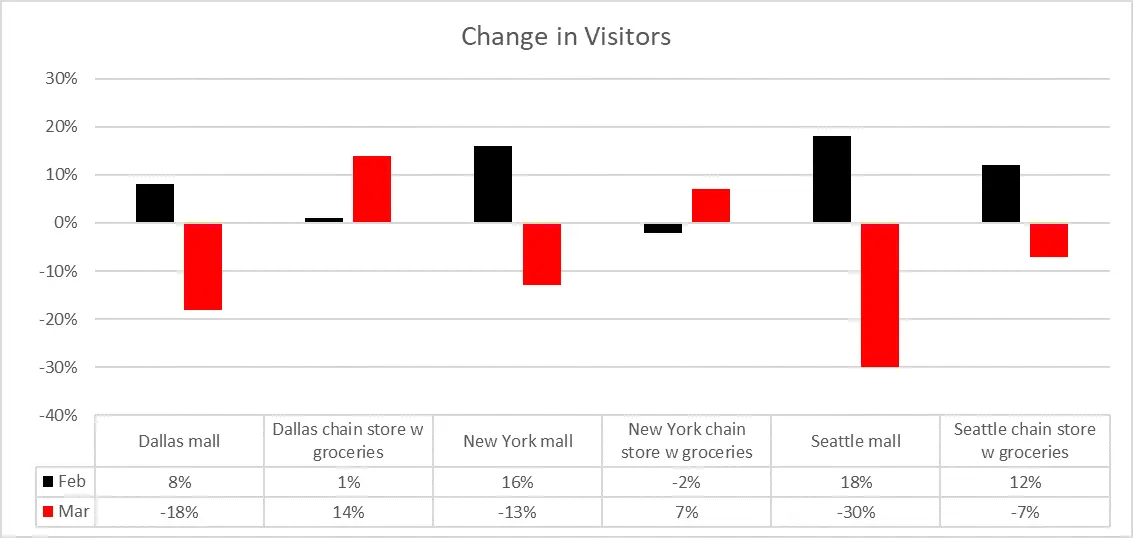
All three non-essential retail locations and two of the three essential retail locations showed increases in visitor traffic for February 2020 compared to 2019 as shown in the graph below. The decline at the third essential retail location was slight (-2%). Given the natural noise within the data, the foot traffic was essentially flat. Compare that with March, where all the non-essential retail locations showed declines greater than 13%. In contrast, the essential retail location in Dallas showed a significant increase in visitors, 14%, and the New York essential retail location had a healthy 7% increase. The essential retail location in Seattle showed a significant decline, -7%, but that was less than half the decline of the nearby non-essential retail location.

Not surprising, the declines at both Seattle stores were greater than the declines in the other two locations.
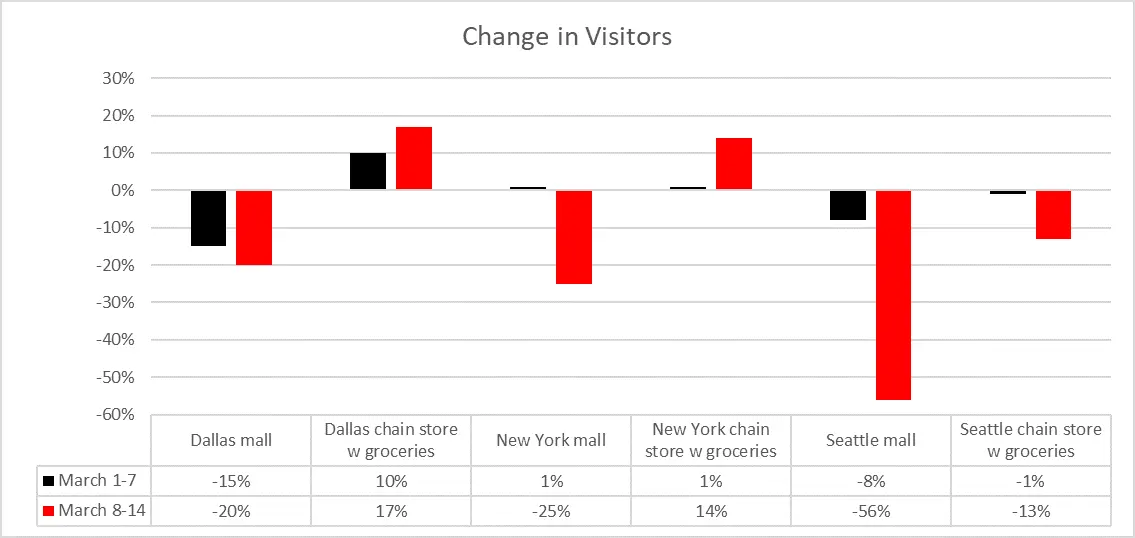
If we split March even further, looking at the first week separate from the second week, a more pronounced pattern emerges. The declines accelerated dramatically after March 7 compared to a year ago as the crisis became better understood by the public and health officials discouraged large crowds and social distancing. All three non-essential retail locations registered significant declines and the declines in Seattle were more than double the drops in New York and Dallas.

Traffic at the Dallas and New York essential retail location’s increase for the second week of March compared to a year ago. However, it is likely that the increase was fueled by fear since the data for the following day shows declines.
Comparing the third Sunday in March 2020, which was March 15, against the similar Sunday in 2019 shows how quickly visitor traffic dropped. Using a single day adds noise to the analysis and the third Sunday in 2019 was March 17, St. Patrick’s Day. However, the decline in foot traffic in all three non-essential retail locations was so dramatic that noise does not account for the decline.
Foot traffic at all three essential retail locations are down significantly on Sunday compared to the previous week as state and local governments encouraged social distancing. Even Dallas, which hasn’t seen the same number of cases as greater New York and Seattle had a decrease in foot traffic.

As health, state and local officials encourage or enforce limits on social interactions, the retail sector will feel the pain. Many investors believe that necessity retail will ‘hold up’ in a recession. The impact to necessity retail appears to be less, but the decline in foot traffic in Seattle and to a lesser extent New York shows that it isn’t immune.
It is unknown how quickly the market will bounce back. However, in contrast to the 2008 recession, new technology allows us to have much more precise and timely views on economic activity. These trends can be viewed at both market and property levels which will give investors much improved market transparency and hopefully alleviate unnecessary risk adjustments over the long term.
While this analysis was a simple sampling and not necessarily a reflection of the larger U.S. market, Advan and Eigen10
Advisors are working to continue to track and analyze the data in a broader and more long-term indexed fashion. For
further information in using these indices, contact Eddy Hribar at  or Jeff Havsy at
  .
.
1 Non-essential defined as a location that is heavily aimed towards clothing, jewelry, entertainment and restaurants whereas essential is defined as retail that is more heavily aimed towards, grocery, pharmaceutical, cleaning and other daily household needs.

