Cellphone geolocation data has proven to be an invaluable tool in helping us understand how COVID-19 is evolving, and to support our recovery.
We have been working closely with clients and other partners to help track the evolution of the pandemic and how it is impacting different sectors, among the most important of which is hospitals.
To help visualize the environment that hospitals are operating under, as well as to provide a measure of hospital bed utilization which is an important metric of the available capacity of the hospitals, we generated a detailed analysis of hospital traffic, filtering out doctors, staff, and visits that did not result in long-term admissions, in order to estimate the actual hospital bed utilization during the pandemic.
Our ongoing analysis includes over 13,000 hospitals and clinics mostly in the US and territories, plus some in the UK, with the data updated daily.
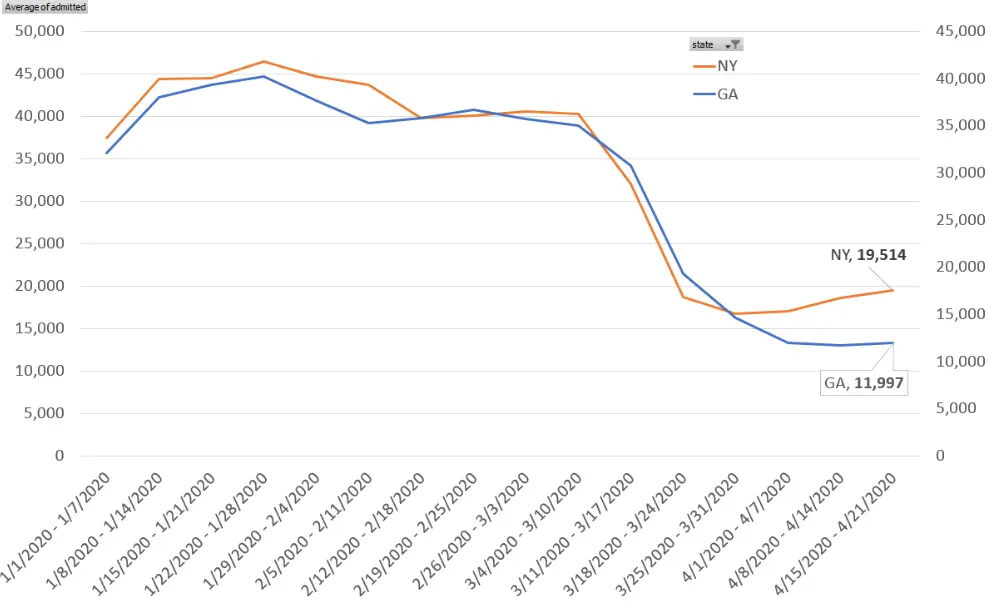
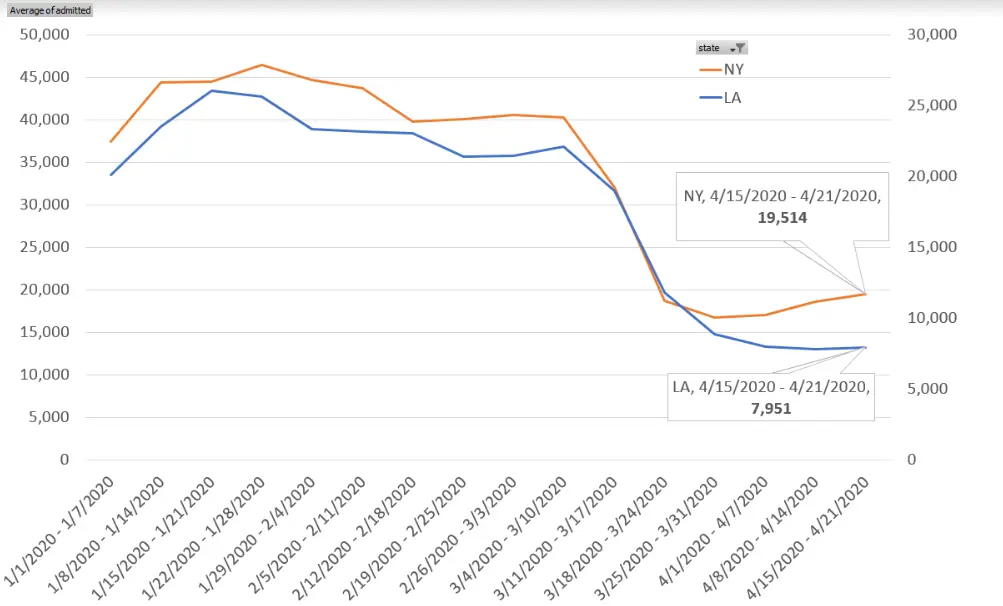
A chart of average daily hospital admissions in New York State, Georgia and Louisiana shows an interesting, though not wholly unexpected trend.
In mid-March, when it became clear that the pandemic was accelerating in the US, we saw hospital admission in all US states fall significantly, as the majority of elective procedures were cancelled.
Within a week, however, we saw this fall level-off and begin to rise again as COVID cases increased. With New York seeing almost twice as many admissions as Georgia:

and almost three times as many as Louisiana during the third week of April:

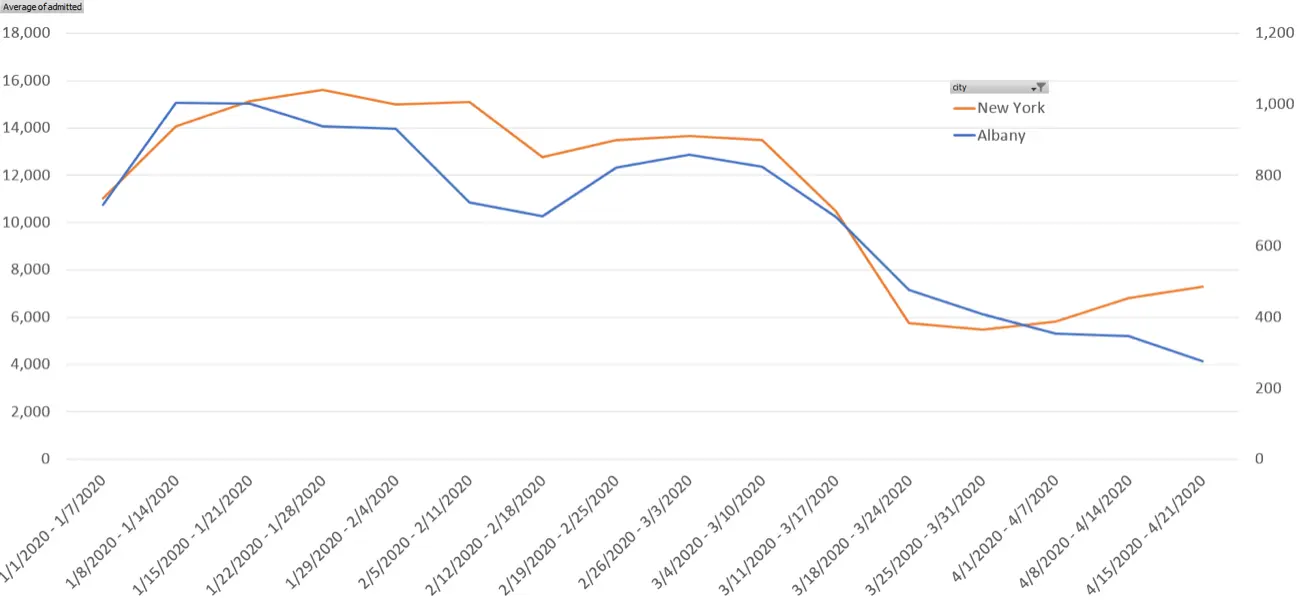
While New York was clearly the hardest hit state, there are important differences within the state itself, with New York City seeing a marked increase in daily admissions through April, while those in Albany gradually fell over the same period:

Tracking admissions is an immediate way to view how these vital resources are coping with a new influx of patients across the US states and around the world.
For more detailed data please contact us.

