Over the past weeks we have been working on new ways to analyze foot traffic, in order to help our clients understand how patterns of movement are changing, and what this means for businesses.
As part of our COVID-19 package we have developed over 200 indices for multiple sectors and industries including restaurants, grocery stores, electronics, cloth-ing/accessories. These sectors can be segmented by US state as a way to visualize the response to COVID19 by using foot traffic as a proxy for social distancing.
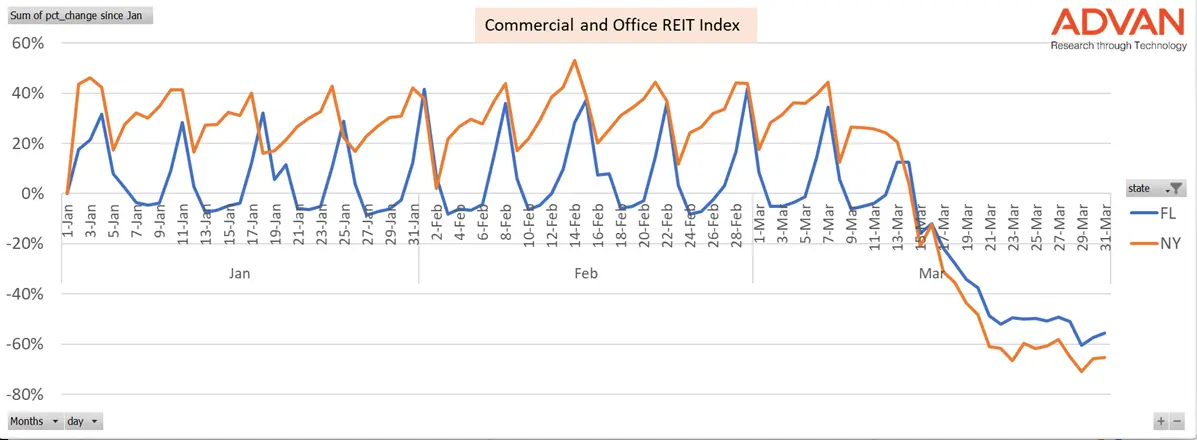
As an example, in the chart below, we've plotted our Commercial and Office REIT Index in two key states - New York and Florida. This Index is composed of more than a hundred REITS from malls and shopping centers to office buildings across the country.
It shows the daily percentage change in foot traffic for these type of locations in each state. In January and February, during the early days of COVID-19 - and before businesses and offices started to close - you can see how the typical weekly pattern differs between the two states. New York has more office buildings and therefore sees more commercial foot traffic during the week. There is also less variation between weekday traffic and weekend traffic (plenty of shopping in New York as well) as the chart shows. Florida sees greater variation, with bigger peaks on weekends to its larger proportion of malls and shopping centers, and fewer office buildings.
While shopping centers and work offices in New York and Florida closed on approximately the same day on both states, we can see that New York reacted more quickly and decisively, with a steeper drop in their daily footfall index and has maintained this downward trend.

Using this index as a barometer we can see how residents of the two states differed in their response. By this measure, it seems that New York took the order to implement social distancing more stringently as soon as it was put in place.
It is important to note that this measure of social distancing is not necessarily correlated with the number of infections in each state. But it does provide a window into how residents are behaving and will give us key insights into the pace of recovery across the various States as offices and stores begin to reopen.

