What does a COVID recovery look like for businesses? 6 months after the initial lock-down we know that, in the US, the journey has been remarkably different for different types of businesses.
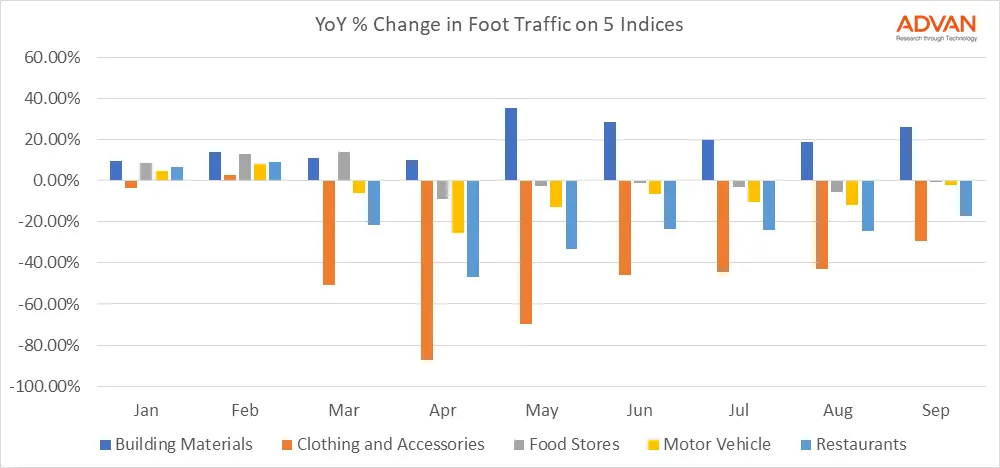
Our foot traffic indices capture trends that show just how varied the path has been. We looked at the percentage change in foot traffic for 5 different sectors during each month of this year.
Starting in March, of those we analyzed, the sectors most quickly impacted were clothing & accessories. With the majority of stores closing across the country, during May foot traffic was 95% down year over year. Clothing business have seen a slow recovery, but even this month traffic remains 30% lower than last September.
Our food stores index - which is made up primarily of grocery stores - saw a small spike in March, and has remained essentially flat or slightly down since then. Increased demand for food due to people staying home was likely counterbalanced by a reduction in the number of people allowed in stores, and an increase in click-and-collect services now offered by many grocery stores.

As has been widely reported, restaurants have also been substantially impacted over the past several months. The tentative recovery over the summer was due largely to the expansion of patio dining. As the weather starts to cool, and especially if there is a second wave of the virus, we anticipate restaurants being among the most affected businesses.
Our motor vehicles index shows the number of people visiting car dealerships. At the nadir in April, visitors to car dealerships were down 15% year over year. Since then, traffic has recovered and in September to date traffic is down just 3%. In our last blog post we dug into how car dealership visitation has varied by automaker and by state.
The building materials index has been a notable outlier, with foot traffic consistently increasing year over year. A result of the home improvement and gardening boom during lock-down. As of last week, foot traffic to building material stores was up 26% year over year.

