Key Points:
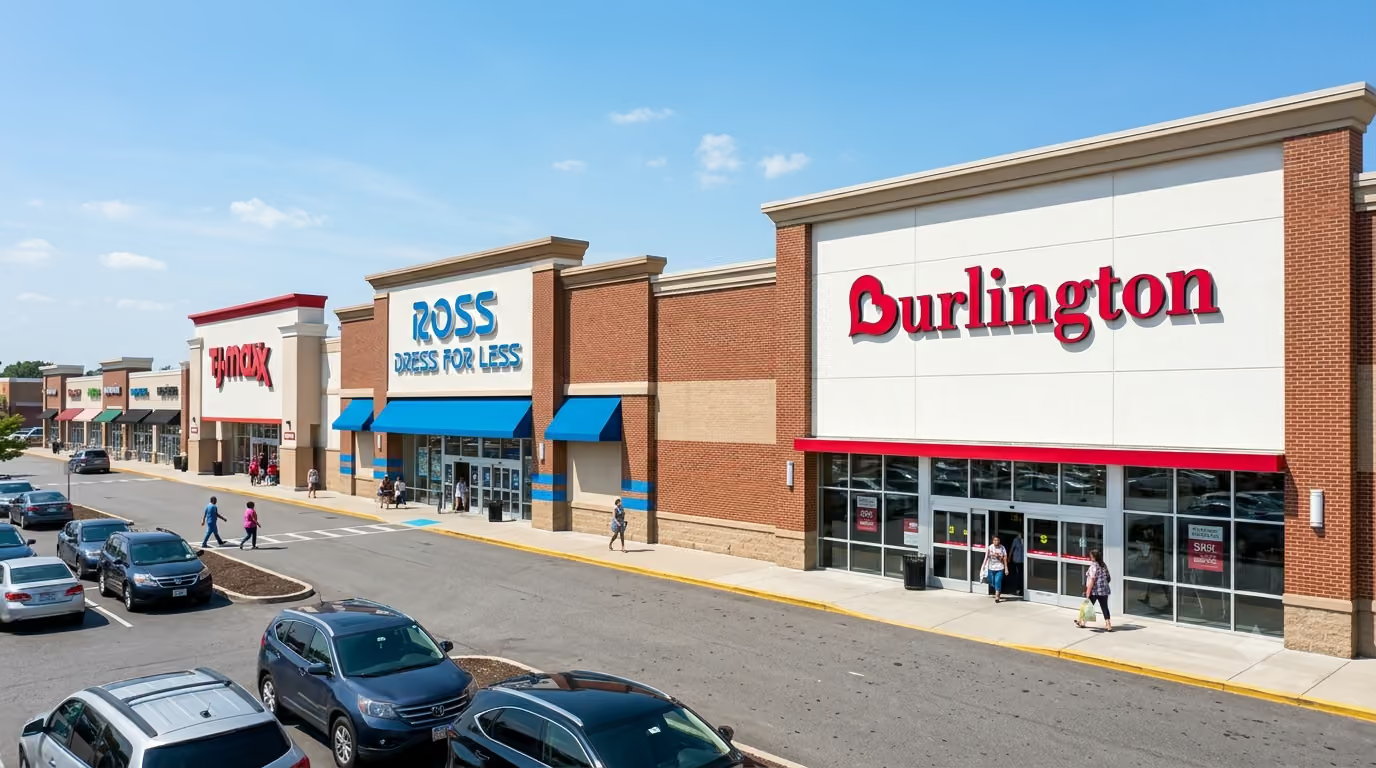
- Off-price’s traffic experienced a depression in May, aligned with the spike in gas prices. Traffic over the past couple of weeks is back to its pre-May pace.
- Given the May depression and stiffer comps for the quarter, TJX (Marmaxx) and ROST are likely to report a deceleration in FQ2 comps. By contrast, BURL should show acceleration.
- BURL’s comp may lead the group in the 2H due to improved execution, strong maturation gains of newer stores, and easier comparisons.
- Should you want to talk about any of this, send me an e-mail.
This past week we were asked by several clients if we were seeing a slowdown in off-price retail as some AltD data providers are suggesting a softer FQ2. After reviewing our data, the answer is yes, but not in an alarming way. FQ1 benefited from a number of 1-offs and an easier 2-year stacked comparison. In our FQ4 and FQ1 reviews, we highlighted these 1-offs and those (kind of by definition) are no longer goosing sales; the 1-offs were higher tax refunds and advantages prestige luxury items that off-price captured during Saks’ discombobulation. We’ve also highlighted for over a year that GLP-1 uptake had fostered an apparel super-cycle. However, as the drug is now reaching more mass adoption, its lift to apparel is less as “the mass” can’t afford to update their entire wardrobe, unlike the affluent, who led the uptake in 2025. And so, while GLP-1s are still a driver to apparel sales, the lift is less than it was in ’25. Lastly, like many sectors of retail, higher gas prices during May created a depression in off-price’s traffic and sales.

In the table below, we’ve tallied what our observed figures show for FQ2 and what that translates to in the 3-year CAGR. (Over the years, we’ve found the 3-year CAGR to be a more informed measure of whether the trend is accelerating / decelerating.) The estimate incorporates both observed traffic and observed ticket.” The 1-year decel is in both traffic and ticket. May was the pothole; July is back at June’s higher level. Ross is outperforming the other two in traffic, conversion, and average ticket. That stems from it doing things differently from the past under CEO James Conroy in terms of more social media marketing, more daring / deeper merchandising assortments, and improvements in the stores (both conditions and staffing), i.e. it’s “contemporized” its approach. The 3-Yr CAGRs demonstrate that the underlying trend for FQ2 for Marmaxx and Ross is “undiminished.”

Burlington’s acceleration is striking. That partly stems from an easier comp basis, but Burlington has also had time to play Conroy’s playbook, which has favorably impacted both traffic and conversion. (We can’t wait to hear what management says on the earnings call.) In addition to that, Burlington’s comp increases are flattered by the maturation of its new stores as they enter the comp base (and the shuttering of underperforming locations). For perspective, Burlington has opened 464 new locations over the past three years and closed 99. Texas has seen the most (+55), increasing Burlington’s Texas footprint by a third. Despite that massive in-fill, Texas as a market outgrew the nationwide average by 40bps on a per-store-average basis. To answer the question of comp maturation we asked Advan+Claude.ai* and got the following response. Bottom line, 1/3rd of the comp-traffic increase is coming from new stores ramping; additionally, older stores are still up ~4%, i.e. very solid.


Stepping back and thinking about the 2H, Marmaxx and Ross have more difficult comparisons. Burlington’s are similar 2H vs. 1H; given that Burlington built momentum during FQ2, plus the maturation driver, perhaps it can lead the group in the 2H. Over the years, we’ve argued that improvements in traffic, conversion, and UPT are signals that shoppers are happy with a retailer. Happy shoppers repeat more (frequency) and promote to friends & family and on social media. That in turn leads to a sequential improvement in comp store-traffic and -sales. With Advan’s observed data and treasure-hunt retailers, we find “dwell time” to be a very informative metric to signal that happy customers are spending more time in a brand’s stores hunting for treasure. All three brands experienced a depression in dwell time during May (higher gas prices again) and in observed average ticket. Dwell time improved in June; we don’t have July’s data, but that’s a key measure ahead of the 2H for the reasons noted. (Reach out to us next month if you want the read.)