Commercial Real Estate Site Selection: How Data Guides Decisions Across Asset Classes
In short
- Site selection criteria change by asset class: retail weighs foot traffic and spend, industrial weighs freight movement and labor access, multifamily weighs migration, and office weighs commuter and daytime population patterns.
- Four data layers, foot traffic, consumer spend, migration, and truck or vehicle movement, recur across every asset class, just with different weighting for each.
- A repeatable framework moves from market and submarket screening to trade area definition, to layering asset-specific data, to scoring candidate sites side by side.
- Institutional investors use the same data differently than tenants: to verify a seller's demand assumptions during acquisition underwriting and to check portfolio-level concentration risk, not to pick one store.
- ADVAN's foot traffic, truck traffic, consumer spend and migration data cover the layers used across retail, industrial, multifamily and office site decisions.
Commercial real estate site selection is the process of evaluating a location before committing capital, a lease, or a construction budget to it. Get it right and a property performs for the life of the hold. Get it wrong and no amount of leasing effort or capital improvement fully offsets a location that never had the right demand behind it in the first place.
What changes the process is the asset class. A grocery-anchored retail center lives or dies on how many people drive past, stop, and spend. An industrial distribution facility lives or dies on how fast a truck can get from the interstate to the dock door and whether there is a workforce nearby to staff it. A multifamily development lives or dies on whether the population within commuting distance is growing or shrinking. An office building lives or dies on whether employers still want their people working in that submarket at all. The underlying question, will demand show up here, does not change. The data that answers it does.
This article walks through how site selection criteria and the data behind them shift across retail, industrial, multifamily and office, lays out a repeatable framework any CRE team can adapt, and explains how institutional investors use the same data differently than a tenant choosing a single location.
What Commercial Real Estate Site Selection Means Across Asset Classes
Site selection is the process of evaluating and choosing a location for a property or use, and the deciding criteria change significantly depending on the asset class. At its core, site selection answers one question: will this specific location support the business or investment case over the time horizon you are underwriting, whether that is a five-year hold, a ten-year lease or a facility meant to run for decades.
Every site selection process, regardless of asset class, works through some version of the same sequence: define the market under consideration, narrow to specific candidate sites, gather data on demand and access at each candidate, and compare sites against each other on consistent criteria. What differs is which data carries the most weight at each stage, and that is where retail, industrial, multifamily and office genuinely diverge.
Site Selection vs Trade Area Analysis vs Location Intelligence
Site selection, trade area analysis and location intelligence are related but not interchangeable. Site selection is the decision-making process: choosing among candidate locations. Trade area analysis is one input into that process: it defines the geographic area a specific site actually draws from, based on where visitors, residents or workers come from, rather than an arbitrary radius drawn on a map. Location intelligence is the broader category of data, foot traffic, spend, demographics, migration, that feeds both trade area analysis and the wider site selection decision.
A useful way to keep these straight: location intelligence is the raw material, trade area analysis is one specific technique applied to a candidate site, and site selection is the decision that trade area analysis and other data inputs support.
How Site Selection Criteria Differ by Asset Class
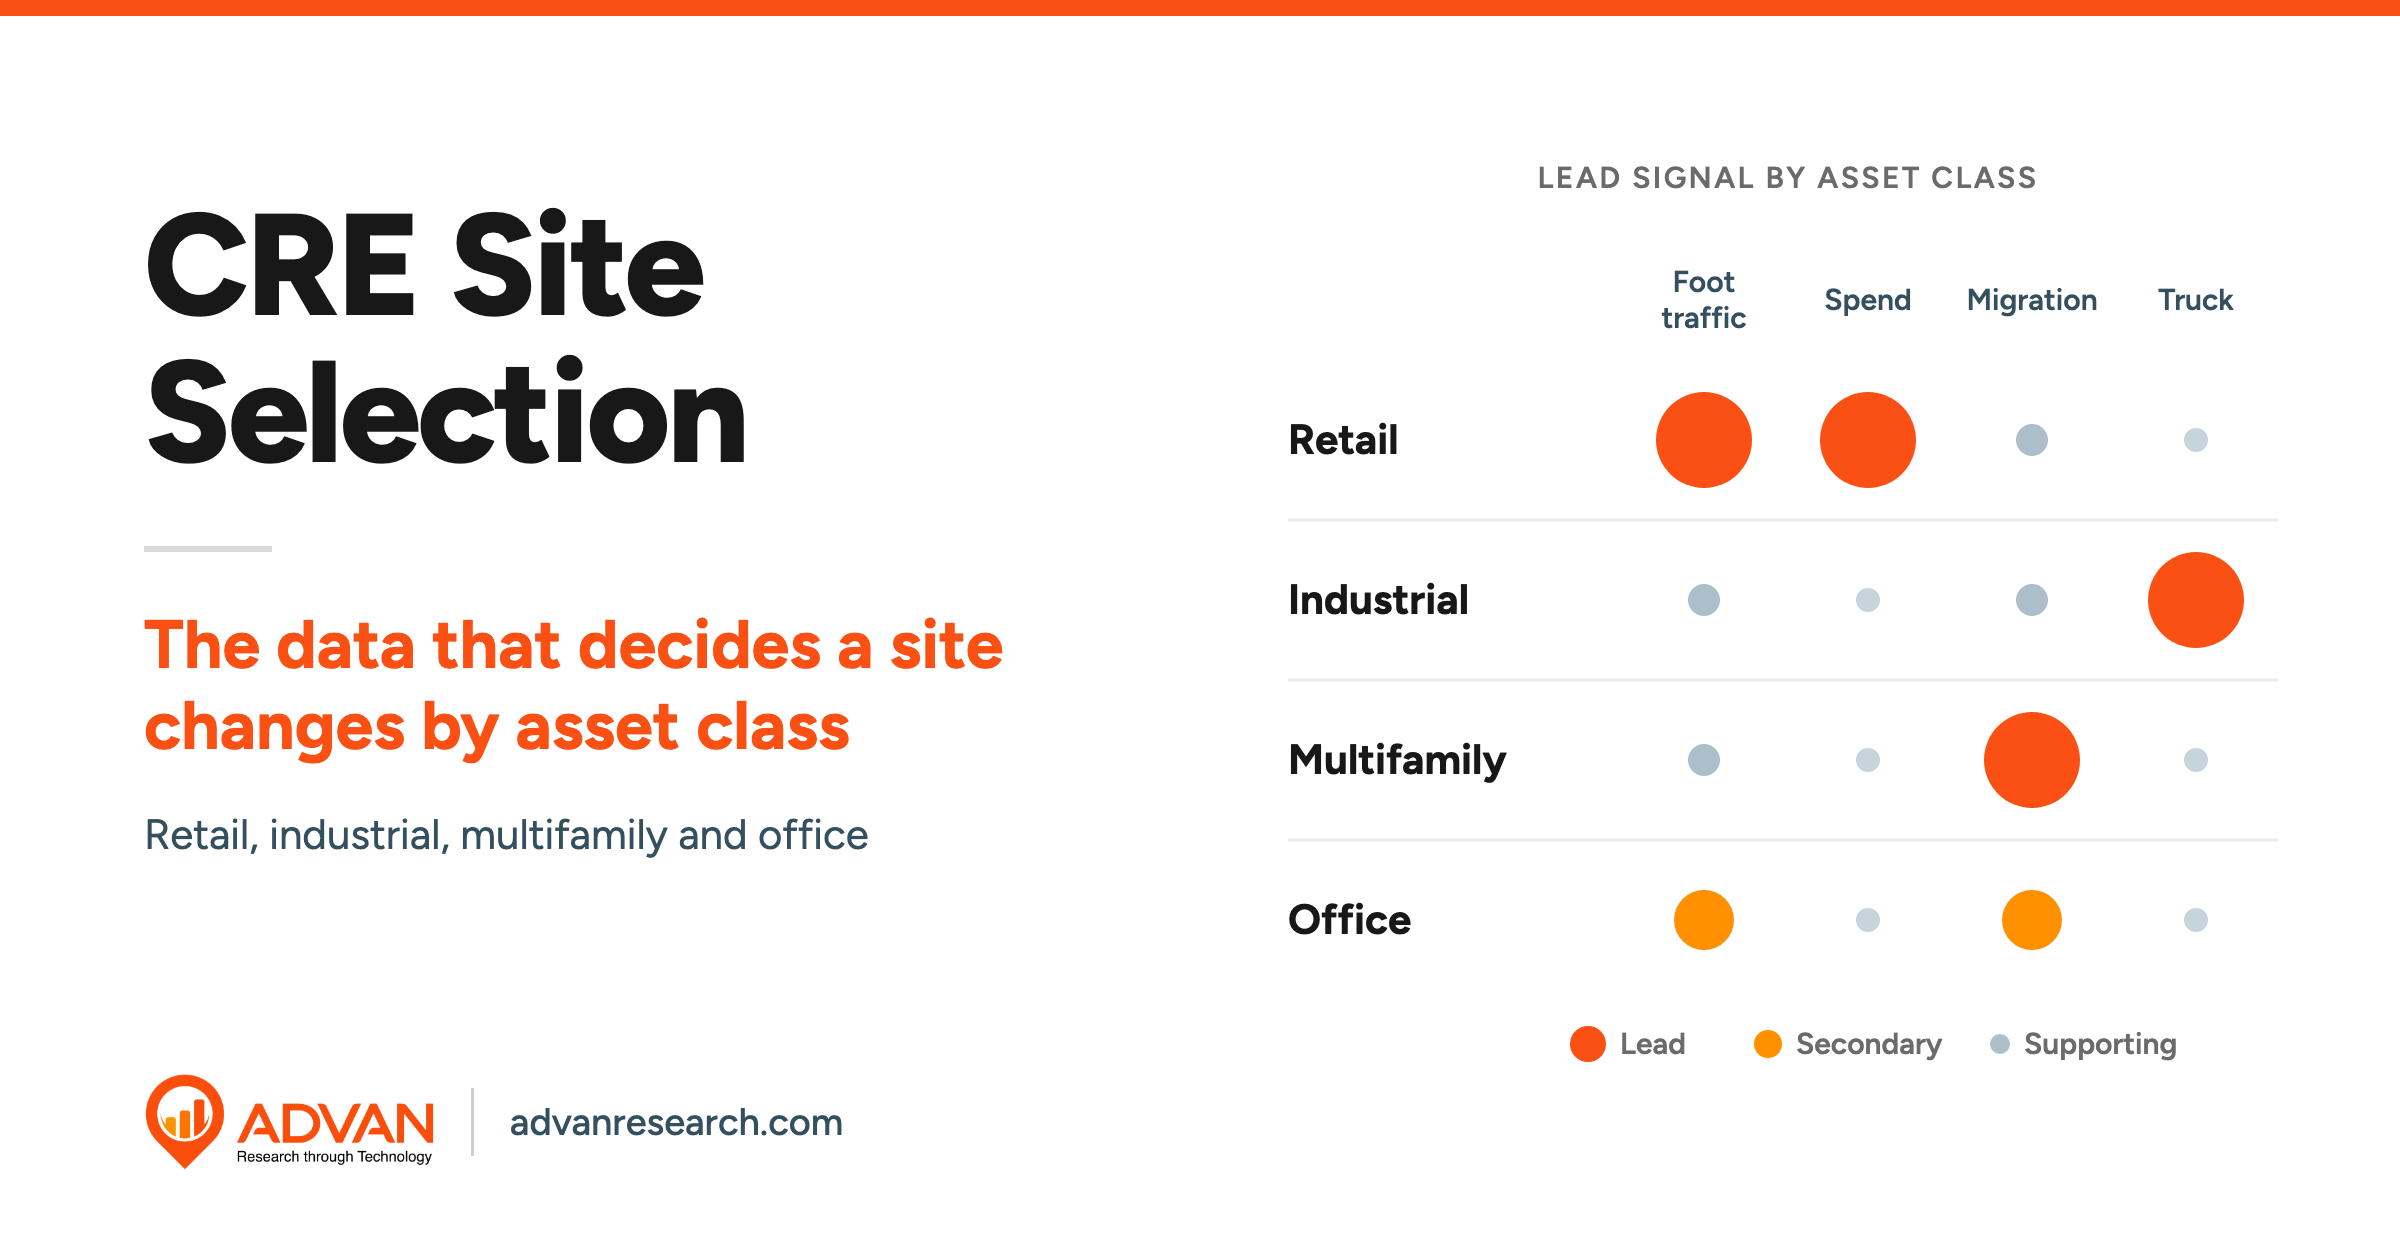
Retail site selection weighs consumer visit behavior and spend, industrial weighs freight movement and labor access, multifamily weighs migration and household growth, and office weighs commuter and daytime population patterns. Each asset class defines demand differently, and site selection data has to match that definition rather than defaulting to a single generic checklist.
This weighting is not just an internal framework. The Urban Land Institute and PwC's Emerging Trends in Real Estate report has for years surveyed investors on the fundamentals they weigh most heavily for each property type, and different criteria consistently top the list depending on whether the asset in question is retail, industrial, multifamily or office.
Retail and Mixed-Use
Retail and mixed-use site selection centers on whether the right customers are already moving through, or near, a candidate location. Foot traffic volume and trend, the true trade area a site would draw, and how much people in that trade area actually spend in the relevant category are the dominant signals. Our retail site selection data guide covers this asset class in depth, including the full data-signal checklist. If you are choosing a location for a store, restaurant or grocery-anchored center, that piece is the more detailed reference; this section exists mainly to show how retail's data priorities compare to other asset classes.
Industrial and Logistics
Industrial and logistics site selection centers on freight movement and labor access rather than consumer visits. A distribution facility needs proximity to interstate highways and intermodal connections, realistic drive times to major population centers or ports, and a labor pool large enough to staff the facility at the wage the underwriting model assumes. Area Development magazine's 2023 Corporate Survey found that highway accessibility and the availability of skilled labor consistently rank among the top factors cited by companies choosing new facility locations. Truck movement data, tracking which routes are actually busy and how volumes shift over time, adds a layer that a highway map alone cannot: it shows whether freight is actually moving through a corridor, not just whether a highway exists nearby.
Multifamily
Multifamily site selection centers on migration and household growth rather than current population counts. A market with a large population but declining migration is a weaker bet than a smaller market with sustained in-migration, because a ten to twenty-year hold depends on who is likely to move in over that period, not just who lives there today. Income and household composition trends matter too: a development pricing units for young professionals needs migration into the metro to be skewing toward that renter profile, not away from it.
Office
Office site selection centers on commuter and daytime population patterns rather than residential population. An office building's demand comes from employers deciding where their people will work, which is a function of commute times from where the workforce actually lives, the daytime population and amenity base already in the submarket, and how competing office product nearby is performing. A submarket with strong residential growth but poor commute access to the employers who would occupy the building is a weaker office site than a smaller submarket with better access, even if the raw population numbers say otherwise.
The Data Layers That Inform Cross-Asset-Class Site Selection
Four data layers, foot traffic, consumer spend, migration, and truck or vehicle movement, recur across every asset class, just with different weighting. Retail leans hardest on foot traffic and spend, industrial leans hardest on truck movement, multifamily and office lean hardest on migration and demographic shift. Knowing what each layer actually measures helps you apply the right weighting for the asset class in front of you.
Foot Traffic and Visit Data
Foot traffic and visit data measures how many people are physically present at a location, when they arrive, how long they stay and where they came from. It is the primary signal for retail and mixed-use, a secondary signal for office, where it captures daytime population and building utilization, and a lighter-weight signal for industrial and multifamily, where visitor and employee counts still matter but are not the main decision driver. Foot traffic data is covered in more depth in our dedicated guide to what it measures and how CRE teams use it.
Consumer Spend Data
Consumer spend data measures actual transaction volume and dollar spend at a location or brand, based on aggregated card transaction records. It answers a question foot traffic alone cannot: are the people visiting an area actually spending money in the relevant category? For retail and mixed-use site selection, this is often the deciding signal. ADVAN's SpendView tracks more than 5,000 retailers, over 900,000 tagged brick-and-mortar locations and more than 40 billion transactions, giving a spend-based view of a trade area that foot traffic counts alone would miss. Spend data matters less for industrial and multifamily site selection, where the underlying decision is not built around a visit-and-purchase cycle.
Migration and Demographic Shift Data
Migration and demographic shift data measures where people are moving from and to, and how the income, age and household profile of an area is changing over time. This is the dominant signal for multifamily site selection and a meaningful secondary signal for office, since where people are moving tends to shape where employers eventually follow. It is also a useful forward-looking check for retail and industrial: a trade area or labor market that is losing population is a risk factor even if current numbers look fine. ADVAN's REPerspectives tracks net in and out migration at the state, metro, county and custom trade area level, updated monthly rather than on the multi-year lag typical of Census-derived demographic data.
Truck and Vehicle Movement Data
Truck and vehicle movement data measures the volume and routing of freight and passenger vehicle traffic on specific roads and corridors. For industrial and logistics site selection, this is close to what foot traffic is for retail: a direct measure of whether the physical movement the business depends on is actually happening at the volume the model assumes. ADVAN's truck traffic data covers 50% of trucks in the US and Canada, which allows a logistics site to be evaluated against real freight movement along specific corridors rather than assumed highway access alone.
A Step-by-Step Site Selection Framework for CRE Teams
A repeatable site selection process moves from market screening to boundary definition to asset-specific data underwriting. The exact data inputs change by asset class, per the sections above, but the sequence of steps holds across retail, industrial, multifamily and office.
Step 1: Market and Submarket Screening
Start by screening markets and submarkets on the broadest indicators relevant to your asset class: population and migration trends for multifamily, employment and freight corridor access for industrial, retail spend and traffic trends for retail, employer base and commute patterns for office. The goal at this stage is to eliminate markets that clearly do not fit, not to pick a final site.
Step 2: Define the Trade Area or Service Area
Once a submarket clears initial screening, define the trade area, catchment or service area each candidate site would actually draw from. For retail this is a true trade area built from real visitor movement, not a radius. For industrial it is closer to a service or delivery radius shaped by drive time and freight lanes. For multifamily and office it is more often a labor or commute shed, the area within which residents or workers realistically live relative to the site. The boundary should reflect actual movement patterns, not an assumed radius, regardless of asset class.
Step 3: Layer Asset-Specific Data
With the trade area or service area defined, layer in the data signals that matter most for your asset class: foot traffic and spend for retail, truck movement and labor data for industrial, migration and household data for multifamily, commuter and daytime population data for office. This is the step where the criteria differences covered earlier in this article get applied to a specific candidate site.
Step 4: Compare and Score Candidate Sites
Score every candidate site on the same criteria so comparisons are apples-to-apples, then rank them. Suppose a logistics developer is comparing three industrial sites outside a mid-sized metro. Site A sits closest to downtown but has weaker highway access and a thinner nearby labor pool. Site B sits fifteen minutes further from downtown but has direct interstate access and truck volumes on the adjacent corridor that have grown over the past two years. Site C has the cheapest land but sits in a corridor where truck volumes have been flat to declining. Scored on freight access and labor availability rather than proximity alone, Site B is the strongest candidate even though it is not the closest or the cheapest. The same logic applies across asset classes: score on the criteria that actually drive performance for that asset class, not on whichever criteria are easiest to measure.
How Institutional Investors Use Site Selection Data Differently Than Tenants
Investors use site selection data to underwrite acquisition risk and portfolio fit, not just to pick a single store location. A retailer choosing a site is answering "will this location work for one store." An investor acquiring a property or portfolio is answering a broader set of questions about risk, correlation and capital allocation across many sites at once.
Acquisition Underwriting
In acquisition underwriting, site selection data is used to independently verify the demand assumptions behind a deal rather than to choose a location from scratch, since the location is usually already fixed by the time a property comes to market. An investor evaluating a shopping center, industrial park or apartment community wants to know whether current foot traffic, spend, migration or truck volume trends support the seller's projections, or whether the trade area, labor market or commute shed is showing signs of weakening that the pro forma does not reflect.
Portfolio Fit and Diversification
Portfolio fit and diversification is the question a single-property buyer rarely asks but an institutional investor always does: how does this site's risk correlate with the rest of the portfolio? A fund with concentrated industrial exposure along one freight corridor is exposed if that corridor loses volume, regardless of how strong any individual property looks in isolation. Site-level data, aggregated across a portfolio, lets investors see whether they are unintentionally concentrated in declining migration markets, overlapping trade areas, or freight corridors exposed to the same shocks. This is the layer at which site selection stops being about one property and starts being about capital allocation across many.
How ADVAN Supports Cross-Asset-Class Site Selection
ADVAN's data spans the layers this article has walked through: foot traffic and consumer spend for retail-adjacent decisions, truck traffic for industrial and logistics siting, and migration data for multifamily and office demand. REI (Real Estate Intelligence) is built for property and tenant-level site selection and benchmarking across asset classes, SpendView and REPerspectives cover the spend and migration layers described above, and FiT (Financial Terminal) and Patterns+ extend the same underlying signals to investors and portfolio-scale users.
For teams working with movement or transaction data at portfolio scale, timeliness matters as much as breadth. ADVAN's foot traffic is delivered T+1: yesterday's data is available before today's market open, which matters when a leasing decision or an underwriting deadline cannot wait for a monthly or quarterly refresh. ADVAN observes more than 45 million U.S. devices feeding that foot traffic signal, and the truck traffic data used for industrial and logistics site evaluation covers 50% of trucks in the US and Canada.
None of this replaces the judgment a site selection team brings to a market: knowledge of local zoning, relationships with brokers, and a read on a submarket's political and regulatory dynamics still matter. What data adds is a way to test those judgments against what is actually happening on the ground, across whichever asset class the decision involves.
The Practical Takeaway
Commercial real estate site selection is not one process with one set of inputs. It is the same disciplined sequence, screen the market, define the trade area, layer the right data, score the candidates, applied with a different set of priority signals depending on whether you are evaluating a retail corridor, a logistics park, a multifamily site or an office submarket. Teams that get this wrong tend to apply retail-style thinking, heavy on foot traffic and light on freight or migration data, to asset classes where that weighting does not hold. Teams that get it right start by asking which data actually drives demand for this asset class, then build the site selection process around that answer.
If you are evaluating sites across more than one asset class, or comparing a target acquisition against a portfolio you already hold, ADVAN for commercial real estate brings foot traffic, spend, truck traffic and migration data together in one place so you are not reconciling several vendors' methodologies before you can even start comparing sites.
FAQs
What is site selection in commercial real estate?
Site selection in commercial real estate is the process of evaluating and choosing a location for a property, lease, or use. It weighs factors like consumer demand, freight access, labor availability, migration trends, or commuter patterns depending on the asset class, then compares candidate sites against consistent criteria to identify the location most likely to support the investment or business case over the hold or lease term.
How does site selection differ between retail and industrial properties?
Retail site selection weighs consumer visit behavior, trade area demographics, and spend in the relevant category, since performance depends on people showing up and buying. Industrial site selection weighs freight movement, highway and intermodal access, and labor market depth, since performance depends on how efficiently goods move and whether a facility can be staffed. The data inputs, foot traffic and spend versus truck traffic and labor data, reflect that difference.
What data do institutional investors use for site selection?
Institutional investors use the same core data layers as tenants, foot traffic, consumer spend, migration, and truck or vehicle movement, but apply them differently. Instead of picking a single location, investors use this data to independently verify a seller's demand assumptions during acquisition underwriting and to check portfolio-level risk, such as overlapping trade areas or concentration in a single freight corridor or declining migration market.
What is the difference between site selection and trade area analysis?
Site selection is the overall decision process for choosing a location. Trade area analysis is one input into that process: it defines the geographic area a specific site actually draws visitors, residents, or workers from, based on real movement data rather than an assumed radius. Site selection uses trade area analysis, along with other data like spend, migration, and traffic, to reach a final location decision.
How do you evaluate a site for a multifamily development?
Evaluating a multifamily site starts with migration data showing whether the surrounding area is gaining or losing population, since a ten to twenty-year hold depends on future renters, not just current residents. Income and household composition trends indicate whether the renter profile matches the planned unit mix. Commute access and nearby employment growth matter as secondary factors, since renters generally need reasonable access to jobs.