Key Points:
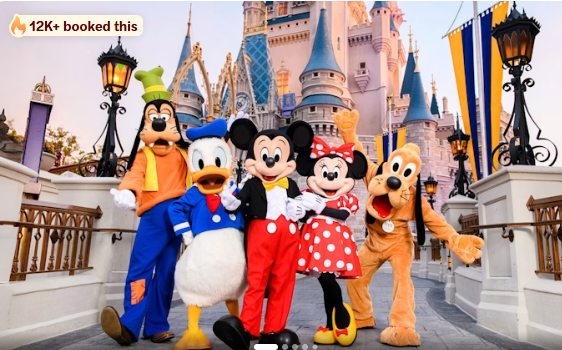
- Observed visits (per Advan) show a strong season* for the industry (in aggregate), led by Disney in Orlando and Universal in California. Fueling the strong season was exceptionally strong spending by the more affluent consumer, a strong line-up of new attractions at the parks (+Epic), and strong success at the box office.
- In-park consumer spend growth is also expected to be healthy (per Advan data). For Disney, we expect hotel occupancy improvement, higher room rates, and the cruise ships to also drive revenue and profit growth.
- SeaWorld and smaller parks were the share donors this year, as is the expectation.
- Halloween is Universal’s big event; the strong summer season portends well for it.

Disney Orlando – Weather in July and August was more benign than in 2025, where July was hit by a heat dome that parked over the region in late July; the dome also produced very high humidity levels (the real-feel heat index held around 100°F. Moreover, plumes of Saharan dust clouded the skies and added to the discomfort. August 2025 held Hurricane Erin (category-5), followed by another Saharan dust storm, versus no major storms in 2026. As such, 2026’s Orlando theme park season had a lot of kindness from the elements.
In terms of events / promotions, Disney’s Mickey’s Not-So-Scary Halloween Party was a big boost to Magic Kingdom’s attendance, and the Kingdom led in observed visits growth for both the season and the July & August period. Disney’s other three large Orlando Parks also performed strongly. (Advan only observes domestic visitation. Lower international visitation is expected to remain a modest headwind to attendance and revenue.) As was the case for Q2, Disney’s Orlando Parks also delivered an increase in observed average visit duration (i.e. minutes in the park), which should drive an increase in per-capita spend on merchandise, food, and beverage.
Disneyland – as was the case in Q2, observed visits were modestly lower YoY, lagging Orlando. California is more of a locals market (than Orlando) and California’s high gas prices (+$1.40 to the national average) may have been a contributor. As was the case at Disney-Orlando, Disneyland’s visit duration increased YoY.
Universal did better in July and August, especially at Universal Studios Florida, whose traffic has suffered due to Epic’s gains. As Epic was in the base period and as Universal has gotten better at packaging, it grew attendance. Moreover, for the July 4th celebrations, its visits growth outpaced Disney’s. However, for the entire summer season, Universal-Orlando’s visit growth was meaningful less than Disney-Orlando. By contrast, Universal Studios Hollywood strongly grew observed visits, demonstrating strong success with its four promotional events during July and August. As a reminder, Universal has been very successful this year at the box office with The Super Mario Galaxy Movie and Minions & Monsters and its films’ stories / characters lift the parks. The Mario release (April 1st) was the #1 worldwide box office success this year; Universal Studios Hollywood has Super Nintendo World, which has benefited from the movie’s excitement. Our data also suggests that Universal did a better job than Disney of capturing a lift from the World Cup audience that visited Los Angeles (this would be of domestic visitors / fans).
There is only so much fun & games to go around, and Disney’s and Universal’s success came at the expense of SeaWorld Orlando, where observed attendance declined for July / August, and held roughly flat for the season (lower international visitation likely pulls the reported figures into the negative (-2-3%). San Diego did modestly better. Average-stay-in-the-park was flat YoY at both parks, inflation will push the per-cap figure into the +2-3% range. SeaWorld San Diego introduced a new nighttime drone show this summer. Observed visits after 8pm, strongly outperformed (>300bps) total day visits and < 8pm visits, demonstrating that the show worked as an attendance draw.
Looking forward, we expect both Disney and Universal to report stronger QoQ domestic theme park results (as it relates to domestic visitation), which supports their large ongoing investment cycles in the business. SeaWorld will likely talk about making 2027 work. After the Q3 earnings reports comes Halloween, which is a big attendance event for all, particularly for Universal. For Universal Studios Hollywood, October observed visits is 50% more than the July / August average. The more successful summer season suggests that Halloween should be strong.
This week at the Goldman conference, Comcast CFO Jason Armstrong shared, “So Epic did incredibly well. That sort of lifted all boats in the Orlando market for us… So it did incredibly well there. What we started to see in June was softness in Orlando. And we articulated that on the call… As we move through the quarter, I would tell you, I don't think anything has changed. We're continuing to see softness in that market. And so it's sort of equal parts, a little bit macro, gas prices, airfare, that's impacting the market a little bit. But also it's -- there clearly was a pull forward. You've seen the park. Epic is a fantastic park. There was a ton of pent-up demand that actually lifted the entire Orlando market for us. You saw that come out of competitors. Obviously, if you rewind the clock a year ago, that was sort of the discussion. Here we are a year later comping against that. And so I think that's playing a little bit of a role now. If you step way back, you asked the question is -- how does that inform future investing? And I would take the lens into Epic, was that a good thing or a bad thing. We're still confident that was the right investment given what we're seeing right now. The answer is absolutely yes. If you look at a from my analyst hat back on, I look at a 2-year stack. How are we doing versus 2 years ago because the pull-forward aspect was what it was. In the Orlando market versus 2 years ago, we are up materially in every metric, right?”
We know Armstrong well, and he likely wanted to keep expectations low so that results would come in better-than-expected, and so he didn’t talk up the strength at Universal Studios Hollywood. Also as noted above, Halloween is a big driver to 2H results and that largely in front of them. Lastly, Comcast typically only shares as little information as possible to keep their learnings private from Disney. The above quote was far more revealing than what they said on their earnings call, but it is in line with our note on Q2 results.
At the same event, Disney CFO Hugh Johnson said, “So we certainly feel good about that. In terms of what else can be learned out of FQ3, I think the biggest one is the market, I believe, tends to think that our business is more cyclical and less sturdy than it is. And I'd point to our performance versus competition as a data point. I think there was a belief going into Q3 earnings that, in fact, we were going to be challenged in Orlando. And in fact, the numbers were quite the opposite. They were rather strong. And that's a lot about our IP. It's a lot about our unique offering that Disney World and Disney broadly is, it's just a very, very different offering than perhaps some of the others. The second is, as we've invested in capacity in the parks, that's a real enabler to growth. And it's something that we're going to continue to do, as you all know, with the significant investment program that we've had in place for a couple of years. We're really seeing the attendance benefits of that. And those benefits are going to keep accruing quarter after quarter and year after year as we continue to make those investments.” (Obviously our figures support Johnson’s assertions. We would have also liked to hear a little about Disneyland’s trends.)