

- We see no indications of a sustained decrease in theme park activity due to higher gas prices, the war in Iran, and / or other macro geopolitical / economic concerns.
- Observed data for Disney suggests another solid result for its US theme parks.
- Observed data for Universal suggests that its legacy parks had a stronger quarter and that Epic is growing the pie for Universal and the overall industry.
- Observed data for SeaWorld / United Parks & Resorts suggests a weaker quarter, in what is a seasonal low period for them; given that its low season, the weakness isn’t an indicator for the year.
- Should you want to talk about any of this, send me an e-mail.
Big picture – the US consumer is remarkable and despite lower consumer confidence and higher gas prices, we haven’t seen any depression in theme park visits, other than a modest and temporary dip in early April. (March visits data is distorted because of one fewer weekend YoY.) For Q1, the theme park trend in California was much improved. Per Visit California, California enjoyed a +3.1% lift in non-resident international air arrivals for March – the first increase in a while (February was -2% and 2025 was estimated to be -9%). Orlando International Airport statistics were stronger for Jan and Feb, and while international is soft, it’s not by much. Our observed data of MCO for March, and April-to-date, show a stronger trend than February. For March, MCO’s stats was +7% for domestic deplaned. (For this insights story, Advan only used observed domestic visits, time spent, and spend. We haven’t employed our international data.)
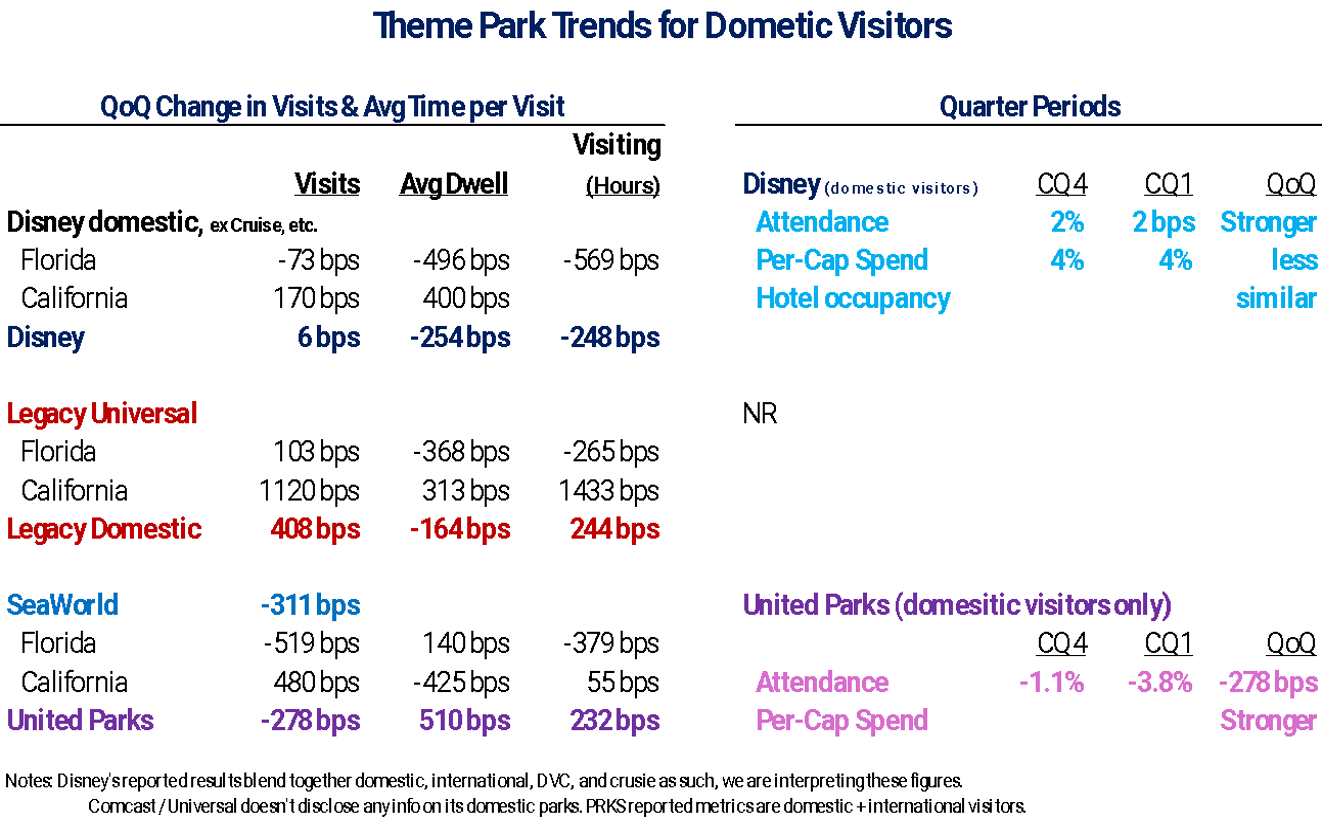
Based upon our observed data, we expect Disney to report solid results for its domestic theme park business (excluding international visitation), and despite weather in Florida that was too cold in the 2H of January and too hot in the 2H of March, both of which led to a shortening of hours visiting the park. Given that dynamic, per-cap spend on F&B might be a little less QoQ, however it shouldn’t impact hotel occupancy. Offsetting the adverse weather in Florida were very strong results in California. Loyal readers (of ours) will recall that Disney largely benefits from its high exposure to more affluent households, as well as its strong offerings and storytelling. That Disney Orlando visits were largely stable (-73bps in attendance QoQ), in the face of Epic Universe significantly increasing admission capacity QoQ (+200K admissions, or + 7.5%, QoQ per our estimates), demonstrates that Epic is largely growing the size of the Orlando market (in aggregate). Moreover for Q1, Disney World and Epic Universe shared 13.6% of the same visitors, down from 15.9% in Q4. The absolute number of shared visitors didn’t change, the ratio declined because more visitors came to Epic, who didn’t go to Disney World. That again demonstrates that Epic is largely growing the size of the Orlando market.
Universal reported results last week, but its disclosures are modest. Revenue and profits increased +25% and +33%, respectively. However, softer results for its Japan and China parks weighed on results, meaning that domestic results were for more robust than the reported figures. We’ve seen sell-side estimates that the domestic parks grew revenue in the 45%-range, up +20ppt QoQ. Our observed data suggests that the ~45% lift was from both Universal’s legacy parks (domestic visitors to the domestic parks) and as Epic. Observed spend data (which includes booked trips) accelerated +16ppts QoQ. Universal’s Florida legacy parks also faced the adverse weather, which weighed on hours in the park. Like Disneyland, Universal Studios Hollywood enjoyed a nice improvement. Importantly, the stronger attendance at the legacy Orlando parks in Orlando in combination with the +7% increase in Epic Universe capacity / admissions demonstrates that Epic is growing the overall Universal franchise.
United Parks & Resorts is going to report a softer quarter; however, Q1 is a seasonally low quarter (only 17% of annual revenue). As such, we don’t think it’s a good read for the summer season, especially as United Parks & Resorts is likely holding back on marketing so that it can light up the summer season. Like with Disney and Universal, California was much improved, but Orlando is where SeaWorld’s weight lies, and the sequentially softer visitation has pulled the total lower. That suggests that Epic is a near-term competitive headwind, especially if SeaWorld pushed marketing dollars from Q1 to the April / May period. Observed spend data for SeaWorld was -300bps softer QoQ, and reflective of the softer attendance. We are pressed to explain the trend in dwell time at SeaWorld Orlando, relative to the market’s trend, or SeaWorld San Diego’s. Perhaps those who attended in Orlando were diehards who wanted to get their money’s worth, whereas the trend in San Diego reflected added new visitors who had yet to learn to maximize their time in the park.
You can find our analysis of Q4 results here, here, and here.