By Thomas Paulson, Head of Market Insights
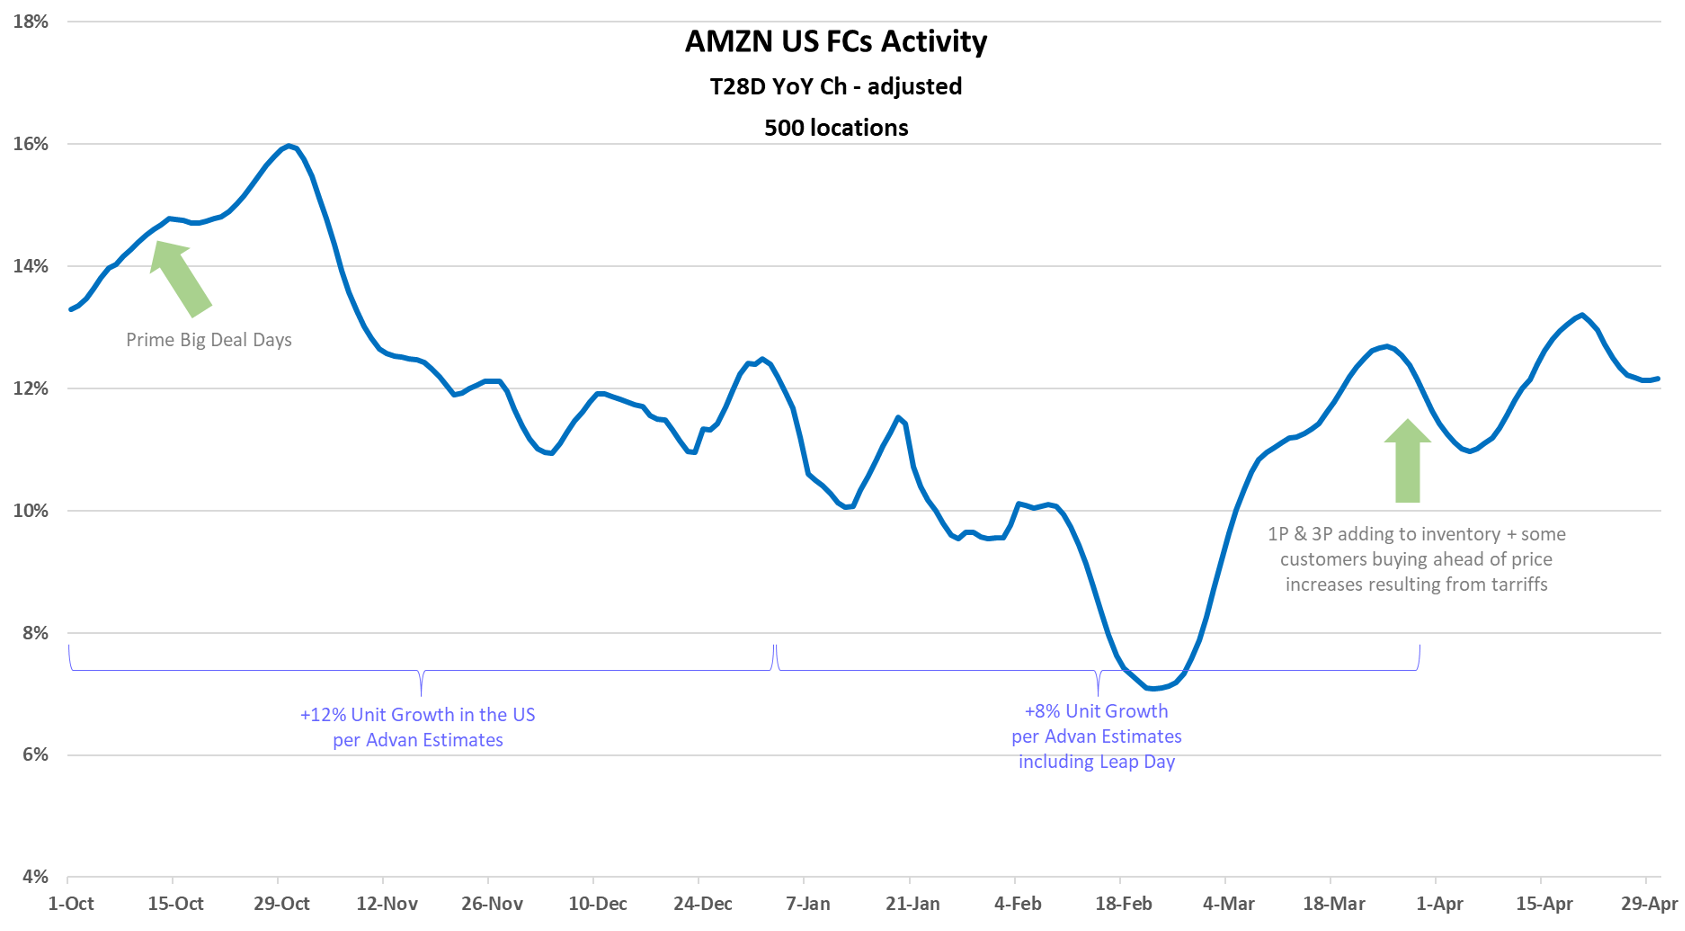
Amazon’s Q1 results and guidance for Q2 reflect what we are broadly witnessing – relatively stable demand for goods, some pull-forward effects ahead of tariffs, and a lot of uncertainty. Including Leap Year, the North American retail business slowed about -400 bps QoQ to around +8% unit growth and +6% $-volume growth, per our estimate. Average ticket fell -200 bps as: (1) Amazon and its third-party sellers have been highlighting savings and lower prices, and (2) consumables (which are generally lower-priced items) grew at +12%, which is twice the rate of general merchandise (our estimate). Consumables have grown at a faster rate than general merchandise for some time and are now one-third of North American sales. Back to the +6% $-volume growth-- that compares evenly to the overall market growth (per Census’ data) when including the ecommerce side of Walmart, Costco, Target, etc. Said differently, Amazon only produced industry-level growth, but at their size, that’s still a lot of dollars.

Management noted a strong April which they suspect was a pull-forward effect from consumers. Amazon and its third-party sellers also are bringing in more inventory ahead of tariffs. (These combined are what’s driving April higher in the chart above.) That leaves a high level of uncertainty for what growth will look like in May and June; that uncertainty marked management’s cautious tone on the call and the Q2 guidance, which was for softer revenue growth (and embedding the expectation for slower retail activity).
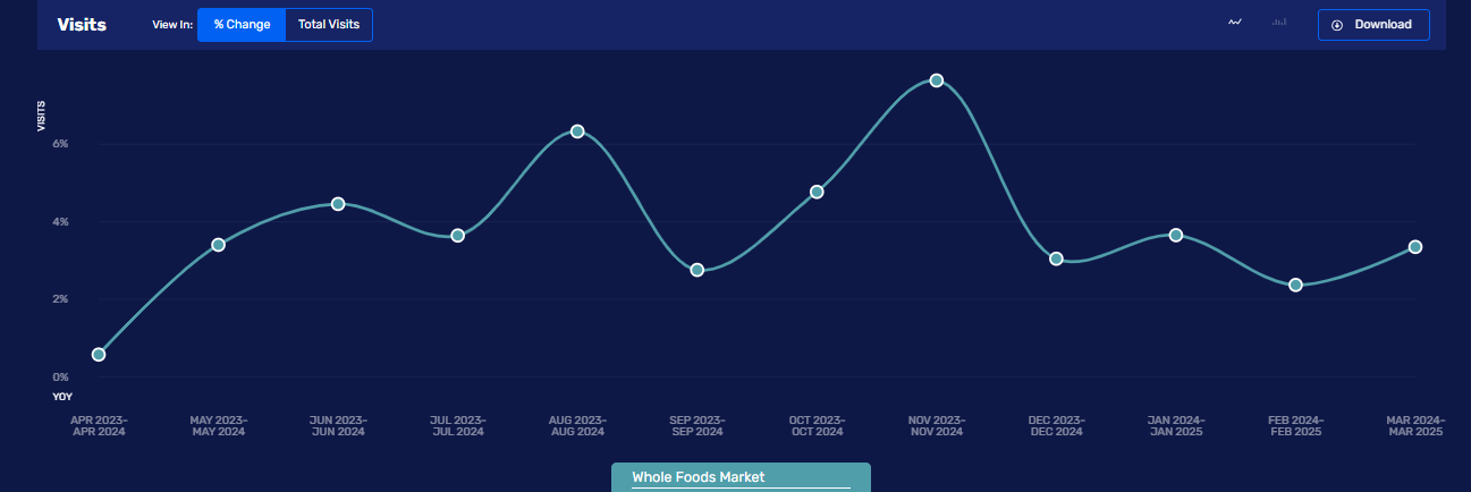
Results at Whole Foods continue to be ahead of the conventional grocery industry (+3.9% per Census). Comp-sales increased by +7%, which drove the 2-year CAGR higher and the sales-per-sq-ft figure to $865. The figure below from our REI platform of traffic-per-location shows nice increases of nearly +4% for each of the quarter’s months. (February is held back nearly -300bps due to the absence of Leap Day). Visitors per location also increased by +4% (some of that could be due to more Amazon returns). Separating the increases in comp-sales from traffic and inflation (+1.9%), implies a nice +1% to 2% increase of units in the basket size. And so, Whole Foods’ store and merchant teams delivered on all of the important top-line KPIs. (Sprouts also delivered, our write up.)

Thomas has been Head of Market Insights for Advan Research since January 2025. Previously, he served as Director of Research and Business Development at Placer.ai, where he was instrumental in providing actionable insights derived from location analytics and the path for expansion into new verticals. His extensive background also includes two decades as a Wall Street analyst and portfolio manager in asset management at Alliance Bernstein, Cornerstone, and others. Linkedin profile.

