Trade Area Analysis: How CRE Professionals Define and Measure Trade Areas
In short
- A trade area is the zone a property actually draws customers or tenants from, and there are four common ways to define it: fixed radius, drive-time polygons, analog or gravity modeling, and data-driven analysis built from real visit origins.
- The right method changes by asset class: retail trade areas track shopping convenience, industrial sites depend on a labor shed, multifamily depends on renter origin and commute patterns, and office depends on the employer's talent pool.
- A useful trade area analysis layers demographic, foot traffic, and migration data on top of the boundary rather than stopping at a population count.
- The most common mistakes are applying one fixed radius to every asset type, ignoring competitive overlap, and never refreshing the boundary once it is drawn.
- Data-driven "true trade area" analysis, built from actual visit origin data rather than assumed geometry, most often changes which site or asset a CRE team ultimately chooses.
Every leasing decision, underwriting model, and appraisal comparable set rests on an assumption about who a property actually serves. That assumption has a name: the trade area. Get the boundary wrong and every number built on top of it, from the demographic profile you pitch to a prospective tenant to the rent comparables you defend to a lender, is measuring the wrong population.
Trade area analysis is the discipline of defining that boundary correctly and then testing it against real behavior rather than a shape drawn on instinct. For CRE analysts, appraisers, leasing brokers, and acquisition teams, this matters because the boundary decision happens early and quietly, often before anyone questions it, and it shapes every conclusion that follows.
This article works through what a trade area is, the four methods used to define one, how the right approach changes by asset class, what data belongs inside a proper trade area analysis, the mistakes that undermine it, and a worked example comparing two candidate sites.
What Is a Trade Area and Why Boundaries Matter
A trade area is the geographic zone from which a property draws the majority of its customers or tenants, and getting its boundary wrong skews every decision built on top of it. If you underwrite a shopping center using a boundary that is too wide, you overstate the addressable population and the rents that population can support. If you draw it too tight, you miss visitors who genuinely drive the property's performance and undervalue the asset.
The boundary decision feeds directly into demographic profiling, competitive analysis, rent comparable selection, and tenant mix planning. A retailer deciding whether to backfill a vacancy with a children's apparel brand needs to know the actual household composition inside the trade area, not the composition of an arbitrary circle on a map. An appraiser selecting comparable sales needs properties that serve a similar population, which is only possible if the trade area itself is defined accurately.
Primary, Secondary and Tertiary Rings
Most trade areas are broken into three rings based on the share of visits or customers they contribute, not a fixed distance. The primary ring is where the bulk of regular visitors live or work, often the tightest geography and the highest-frequency segment. The secondary ring contributes a meaningful but smaller share, typically visitors willing to travel further for a specific tenant or category. The tertiary ring captures occasional visitors drawn by a unique draw, a destination tenant, or an event.
The practical value of this segmentation is that it lets you weight your analysis. Demographic and spend data from the primary ring should carry more influence in a leasing or underwriting decision than the same data from the tertiary ring, because the primary ring is doing most of the work.
Why a Trade Area Is Not a Fixed Shape
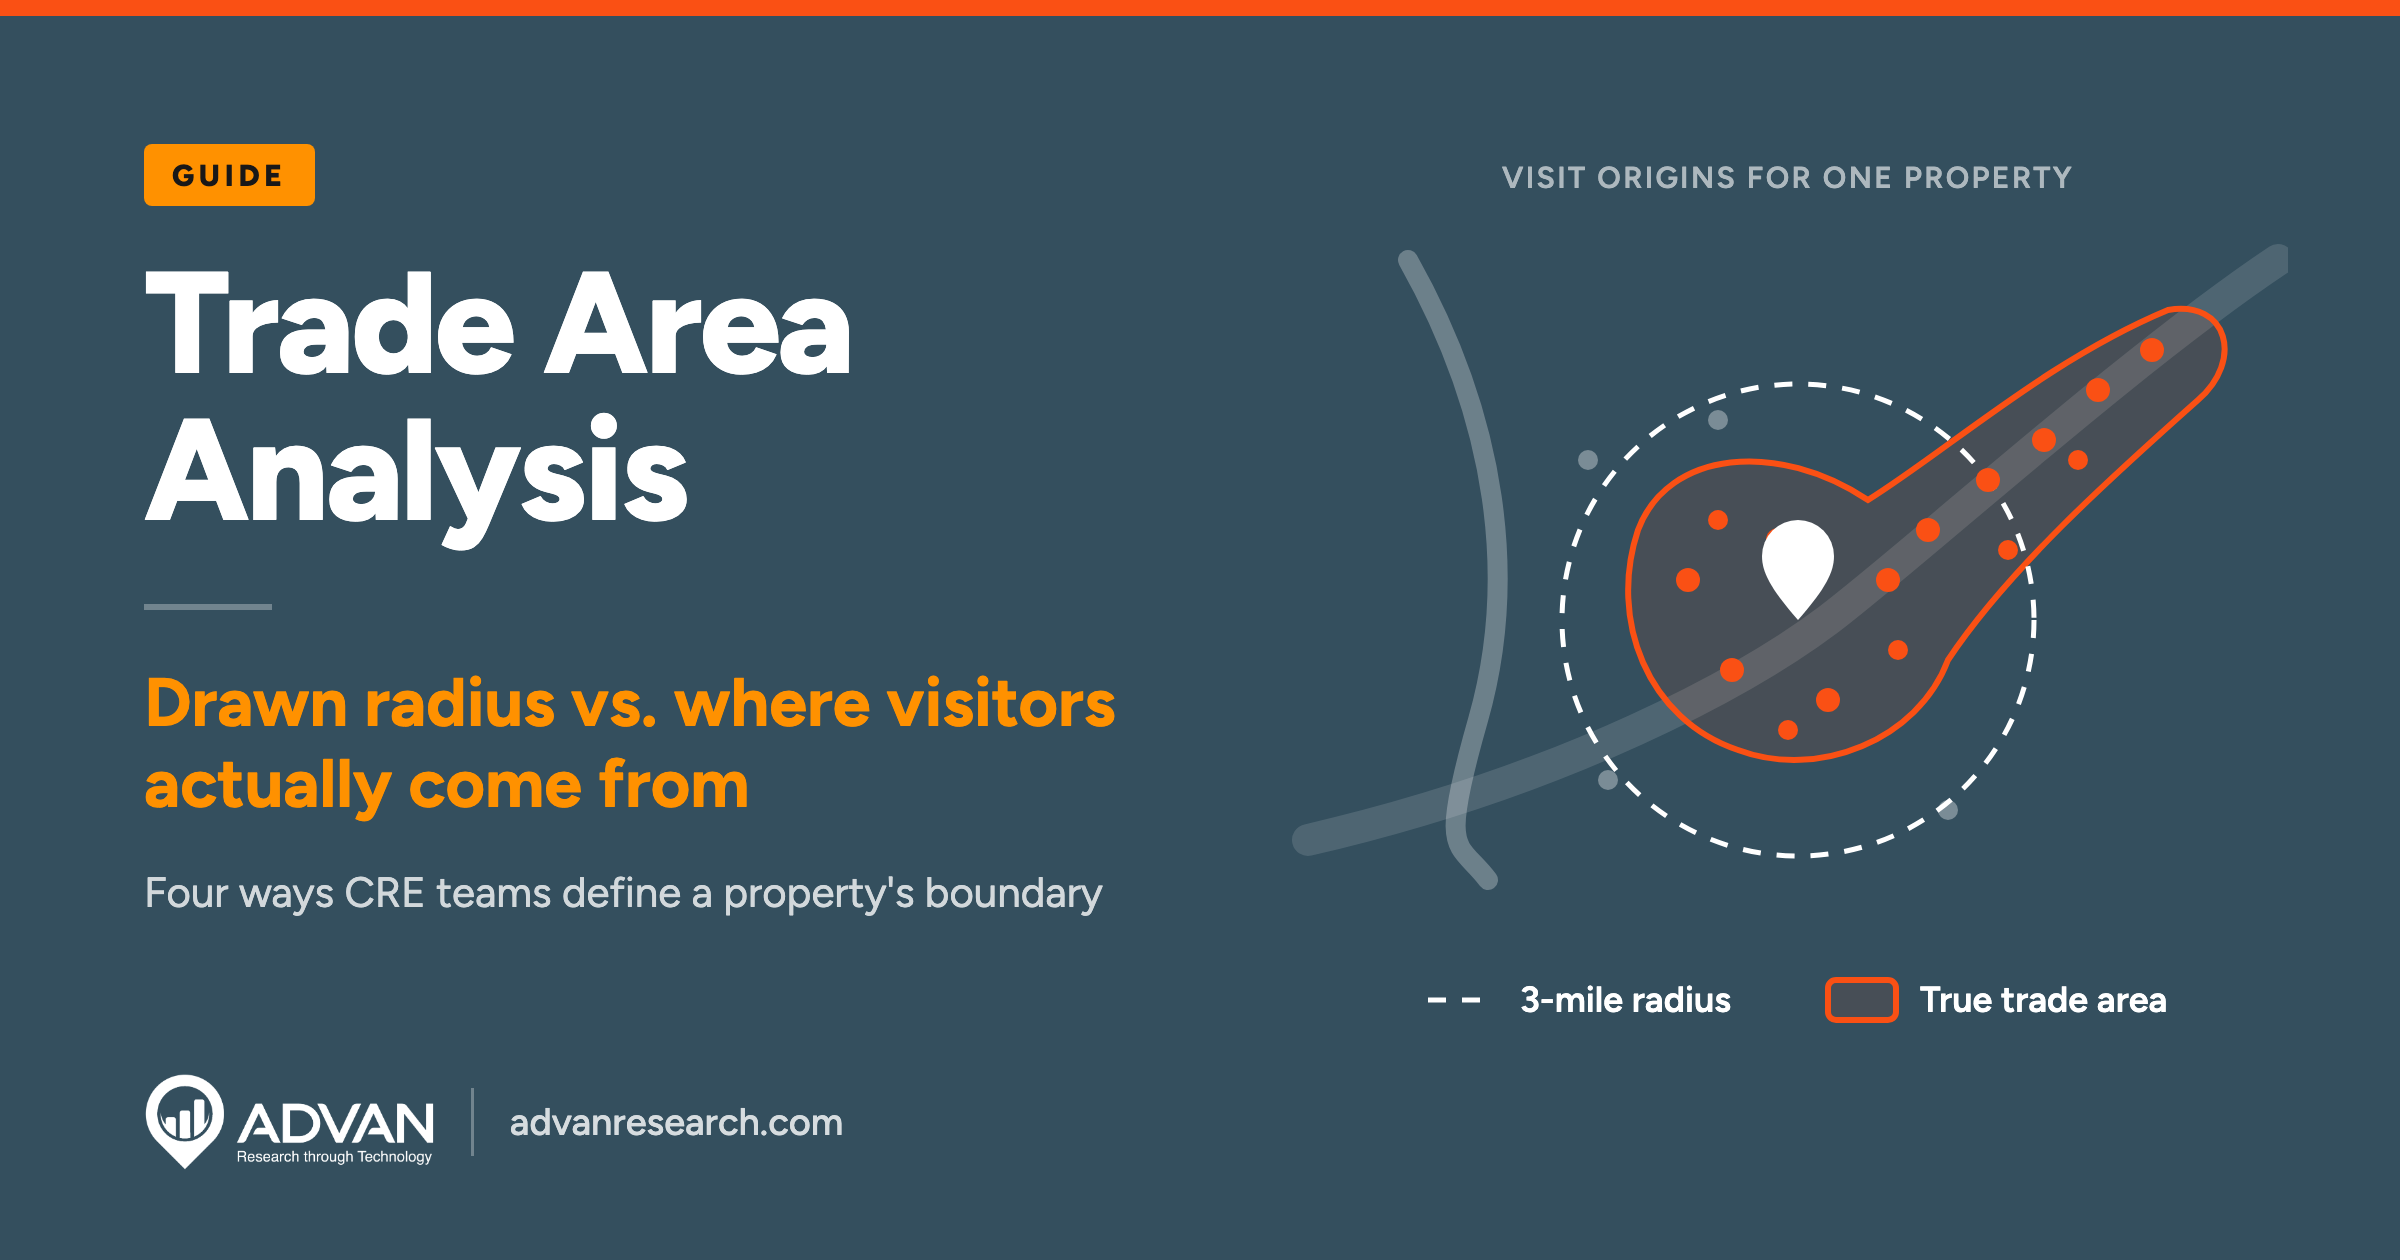
A trade area is not a circle, and treating it as one is the single most common error in the discipline. Real catchment areas follow roads, highway interchanges, rivers, rail lines, and competitive positioning. A property next to a highway on-ramp can pull visitors from ten miles away along a single corridor while barely reaching a neighborhood two miles away on the other side of a barrier. This is why practitioners increasingly refer to a "true trade area," a boundary built from where visitors actually originate rather than a shape assumed in advance.
Trade Area Analysis Methods Compared
There are four common ways to define a trade area: fixed radius, drive-time, analog or gravity modeling, and data-driven analysis based on actual visitor origins. Each method trades off speed, cost, and accuracy differently, and the right choice depends on how much is riding on the decision.
Radius Rings
A radius ring is the simplest method: pick a distance, usually one, three, and five miles, and draw a circle around the property. It is fast and requires no specialized data, which is why it remains common in early-stage screening. Its weakness is that it assumes people travel equally in every direction, which is rarely true once you account for highways, rivers, competing centers, or simply which side of a busy road a resident lives on.
Drive-Time Polygons
A drive-time polygon replaces the circle with a shape built from actual road networks, showing the area reachable within a set number of minutes. This is a meaningful improvement over a radius because it respects real infrastructure: a five-minute drive-time polygon along a highway corridor looks nothing like a five-minute polygon in a dense urban grid. The limitation is that a drive-time polygon still describes what is theoretically reachable, not where visitors actually come from. It is a better guess, not a measurement.
Analog and Gravity Models
Gravity models estimate the probability that a consumer chooses one location over competing options based on the relative size and distance of each option, an approach most closely associated with the economist David Huff. Commercial GIS platforms build trade area and site-selection tools around this type of model. Analog models work similarly by comparing a proposed site to existing, comparable locations and transferring their observed performance. Both approaches are useful before a property opens and no visit history exists, but they depend on the quality of the comparable data and the assumptions built into the model.
Data-Driven "True Trade Area" Analysis
A data-driven trade area is built from the observed home or work locations of people who actually visited the property, rather than assumed geometry. This produces an irregular, often surprising shape: a strong corridor pulling from a specific commuting route, a hard edge where a competitor intercepts demand, or an unexpected secondary cluster from a neighborhood a radius study would have excluded entirely. Because it is based on real behavior, it can also be recalculated as behavior changes, which the earlier three methods cannot do without starting over. This is the approach behind the site selection data checklist that pairs a defined trade area with the other signals a retail decision actually needs.
How Trade Area Analysis Differs by Asset Class
A trade area for a suburban retail strip looks nothing like the labor shed a distribution center depends on, so the right method changes with the asset type. Applying a retail-style radius or drive-time ring to every property type is one of the fastest ways to produce a misleading analysis.
Retail and Mixed-Use
Retail trade areas are shaped by convenience, category, and cross-shopping. A grocery-anchored center typically draws a tight primary ring of a few miles in dense suburban markets, while a big-box or destination retailer can pull from a much wider radius because shoppers are willing to travel further for a specific brand or price point. Mixed-use properties complicate this further because residential, office, and retail components each have different draw radii layered on the same site.
Industrial and Logistics
Industrial and logistics assets are not defined by customer draw at all. The relevant boundary is a labor shed, the geography from which a facility can reliably staff itself, typically defined by an acceptable one-way commute time for hourly workers. A distribution center's trade area analysis also has to account for highway access and drive time to its own customer base further down the supply chain, not just the workforce shed.
Multifamily
A multifamily trade area is built around where current and prospective renters live, work, and compare rents, which usually means overlapping submarket boundaries rather than a clean radius. Renter migration into or out of a submarket, and the commute distance to major employment centers, matters more here than a fixed-mile ring, because a renter choosing between two comparable buildings is comparing commute and price, not proximity to the leasing office.
Office
An office trade area is effectively the tenant's talent pool: the commute shed from which the tenant's own employees are drawn or could realistically be recruited. This is why office landlords increasingly analyze the residential distribution of a tenant's existing workforce, or of comparable companies in the same industry, rather than treating the building's trade area as a fixed geography around the address.
What Data Belongs Inside a Trade Area Analysis
A useful trade area analysis layers demographic, foot traffic and migration data on top of the boundary, not just population counts. The boundary tells you where to look. These layers tell you what you are actually looking at.
Demographic Overlays
Once a trade area is defined, demographic overlays show income levels, age distribution, and household composition inside that specific boundary rather than a generic radius. Demographic data answers who lives in the trade area. It does not, on its own, tell you whether they actually visit or spend at the property.
Foot Traffic and Visit Origin Data
Foot traffic data shows how many people actually visit a property, how often, and for how long, and visit origin data is what turns an assumed boundary into a measured one. This is the layer that separates a data-driven true trade area from a drawn one, and it is worth understanding on its own terms; see foot traffic data and store traffic data for a deeper look at how these signals are collected and used at the property level.
Migration and Long-Term Shift Data
Migration data shows whether the population inside a trade area is growing, shrinking, or changing in composition over time, which matters for any decision with a multi-year horizon. A trade area that looks strong on today's demographic snapshot but is losing population steadily will not support the same rent growth assumptions over a ten-year lease. This layer is what tells you whether the boundary you have drawn today will still describe the same market by the time a hold period ends.
Common Trade Area Analysis Mistakes
The most common trade area mistakes are using one fixed radius for every asset type, ignoring competitive overlap, and never updating the boundary as behavior changes. Each one is easy to make because each one looks reasonable in isolation.
Static Radius for Every Asset
Applying the same three-mile ring to a grocery-anchored center, an industrial park, and a multifamily property treats three fundamentally different draw patterns as identical. A radius that makes sense for convenience retail says nothing useful about a distribution center's labor shed or an apartment building's commuter base.
Ignoring Competitive Draw
A trade area analysis that does not account for a competing property drawing from the same population overstates the addressable market. Two shopping centers three miles apart are not each entitled to their own full radius of demand; they are splitting an overlapping one, and the split is rarely even.
Failing to Refresh the Analysis
A trade area drawn at acquisition and never revisited becomes a historical artifact rather than a decision tool. New development, a competitor opening nearby, a road realignment, or a multi-year migration trend can all shift the real boundary well before a lease renewal or refinancing forces anyone to look again.
A Practical Trade Area Analysis Example
Comparing two candidate sites side by side shows how method choice and real visit data change the conclusion. Suppose a regional retailer is choosing between two suburban sites for a new store.
Site A vs Site B
Using a standard three-mile radius, Site A shows a population of roughly 45,000 with an average household income of about $72,000, and Site B shows a smaller population of roughly 33,000 with an average household income of about $68,000. On a radius comparison alone, Site A looks like the stronger choice by a wide margin.
- 3-mile radius population: Site A: ~45,000; Site B: ~33,000
- Radius avg. household income: Site A: ~$72,000; Site B: ~$68,000
- Drive-time (10 min) population: Site A: ~38,000; Site B: ~41,000
- Existing competitor overlap: Site A: High, shares corridor with an established competitor; Site B: Low, no direct competitor within drive-time
Once a ten-minute drive-time polygon replaces the radius, the picture shifts: Site A's reach is constrained by a river crossing, while Site B sits on a highway corridor that pulls in more of the surrounding population than its radius suggested. Site A also shares its main access corridor with an established competitor, something a radius or drive-time view alone does not fully capture.
What the Data-Driven View Adds
A data-driven true trade area, built from where actual visitors to comparable nearby retailers originate, shows that roughly 30 percent of Site A's theoretical draw already visits the competing center regularly, meaning real available demand is meaningfully lower than the radius or drive-time numbers implied. Site B's observed visitor origins, by contrast, extend further along the highway corridor than either the radius or drive-time view suggested, picking up higher-income commuter traffic passing through daily. The retailer that stops at the radius comparison picks Site A. The retailer that tests the assumption with real visit data picks Site B, and for defensible reasons.
How ADVAN Turns Trade Area Assumptions Into Measured Boundaries
The methods above work with any data source, but they are only as good as the boundary and the visit data feeding them. REveal builds custom polygon trade areas directly from a database of more than 150 million buildings and more than 9 million branded points of interest, so the boundary reflects the actual property footprint and its surrounding points of interest rather than a hand-drawn circle.
Because the underlying foot traffic feed is verified at 95%+ accuracy against ground truth sources such as tenant data and people counters, a true trade area built on ADVAN's data is testable against real-world outcomes, not just internally consistent. Data is delivered on a T+1 basis, meaning yesterday's visit activity is available before today's market opens, which matters when a trade area needs to reflect a recent competitive opening or seasonal shift rather than a stale snapshot. REPerspectives layers migration and demographic change on top of a defined trade area, which is the piece that tells you whether today's boundary will still hold in three years. For portfolio-level work, REI and Patterns+ apply the same true trade area logic across dozens or hundreds of properties at once, which matters for a landlord or REIT comparing trade area health across an entire portfolio rather than one site at a time.
None of this replaces judgment about a market, a tenant, or a deal. It replaces an assumed boundary with a measured one, which is the difference the earlier worked example was built to show.
The Practical Takeaway
Trade area analysis is not a single number or a single map; it is a method choice that should match the stakes of the decision. A radius ring is fine for a first screen. A drive-time polygon is a reasonable improvement for comparing sites with different access. Anything that involves signing a long lease, underwriting an acquisition, or defending a valuation deserves a data-driven true trade area, tested against real visit origins rather than assumed geometry, because the boundary you draw quietly decides every number that follows it.
If you are defining or re-testing a trade area for a property or portfolio decision, ADVAN for commercial real estate walks through how true trade area data, foot traffic, and migration signals fit into leasing, underwriting, and due diligence workflows, or you can go directly to the team to talk through a specific site.
FAQs
What is a trade area in commercial real estate?
A trade area is the geographic zone from which a property draws the majority of its customers, tenants, or workforce. It is used across leasing, underwriting, and appraisal to define the population, competitive set, and demand that a specific property realistically serves. Trade areas are usually divided into primary, secondary, and tertiary rings based on the share of visits or customers each ring contributes, rather than a single fixed distance from the property.
What is the difference between a trade area and a catchment area?
The terms are largely interchangeable in commercial real estate, though "catchment area" is used more often in retail and residential contexts while "trade area" is more common across asset classes. Both describe the geography a property draws from. A true trade area or true catchment area specifically refers to a boundary built from actual observed visitor origins rather than an assumed radius or drive-time shape.
How do you calculate a trade area?
A trade area can be calculated four ways: drawing a fixed-mile radius around the property, building a drive-time polygon from the road network, applying an analog or gravity model that estimates draw based on size and distance relative to competitors, or building a data-driven true trade area from the actual home or work locations of observed visitors. The method should match the stakes of the decision; higher-stakes decisions warrant data-driven analysis over assumed geometry.
What data should go into a trade area analysis?
A complete trade area analysis layers demographic data (income, age, household composition), foot traffic and visit origin data (who is actually visiting and from where), and migration data (whether the population is growing, shrinking, or shifting over time) on top of the defined boundary. Population counts alone tell you who lives in an area; the other layers tell you whether they actually visit, spend, and will still be there over the hold period.
How often should a trade area analysis be updated?
A trade area should be revisited whenever something changes the local competitive or infrastructure landscape, such as a new competitor opening, a road or access change, or a meaningful migration shift, and at minimum at each lease renewal, refinancing, or acquisition review. Treating a trade area as fixed for the life of a hold period is one of the most common mistakes in the discipline, since boundaries drawn at acquisition rarely hold for a full lease term.