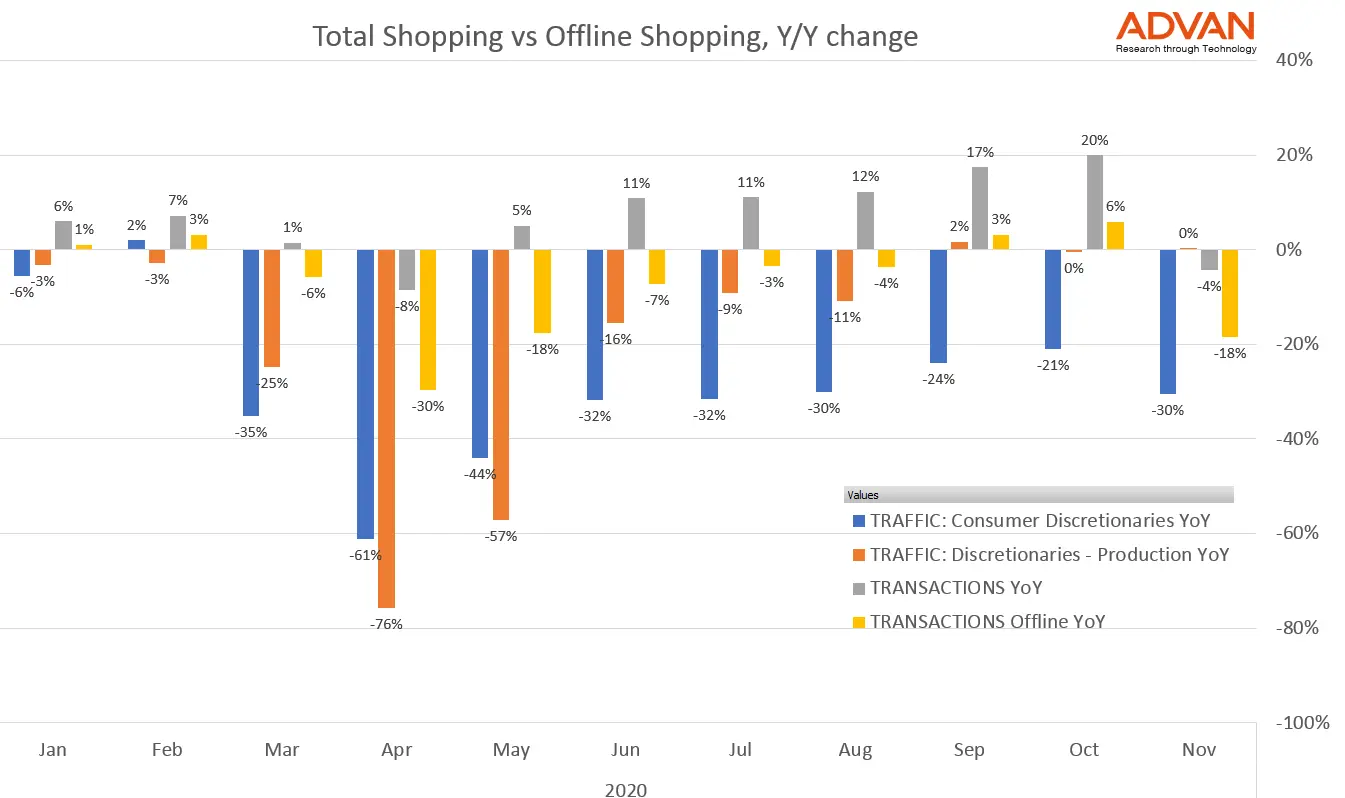
There is no question that a segment of retail has moved online this year. Offline (i.e.in-store) credit and debit card spending is down 15% year-over-year versus total spend according to transaction data from ConsumerEdge.
Foot traffic at consumer discretionary store locations is also 20% lower year-over-year than foot traffic to production locations for consumer discretionary retailers.
These parallel trends show us that foot traffic trends at store locations closely reflect offline spending, while traffic at production facilities gives us a window into total spend - both online and offline.

The number of visitors at consumer discretionary businesses is a good bellwether for activity since it gives us insight into how willing people are to travel for non-essential goods.
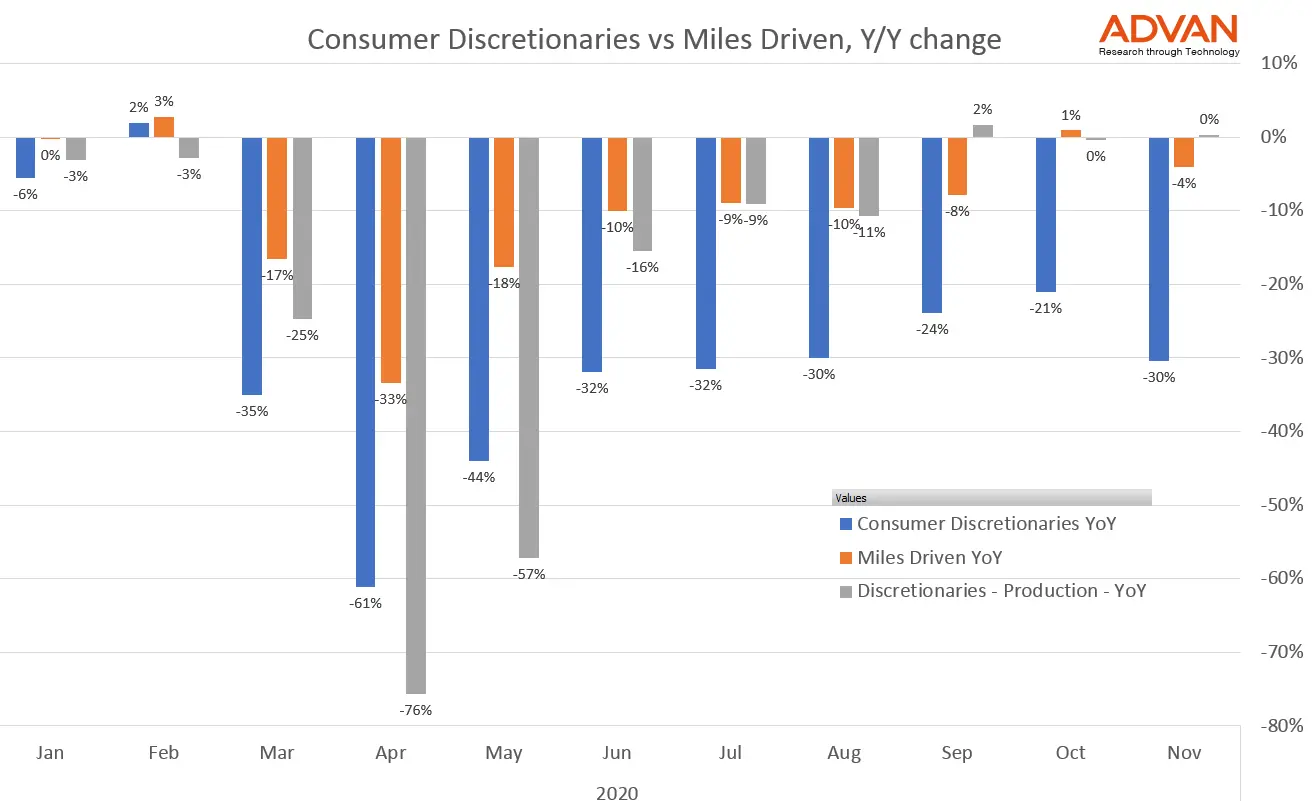
Another useful measure of activity is our Miles Driven index, which correlates at approximately 0.90 with the Highway Administration’s miles driven estimates.
When we compare miles driven data with consumer discretionary foot traffic we notice an interesting trend. While the number of miles driven has been more or less flat over the past 3 months - down only 4% year-over-year - in November consumer discretionary foot traffic was down 30% due to a renewed lock-down measures across the country.

So US residents are moving around the country but they are visiting stores in much lower numbers than we would normally expect at this time of year.
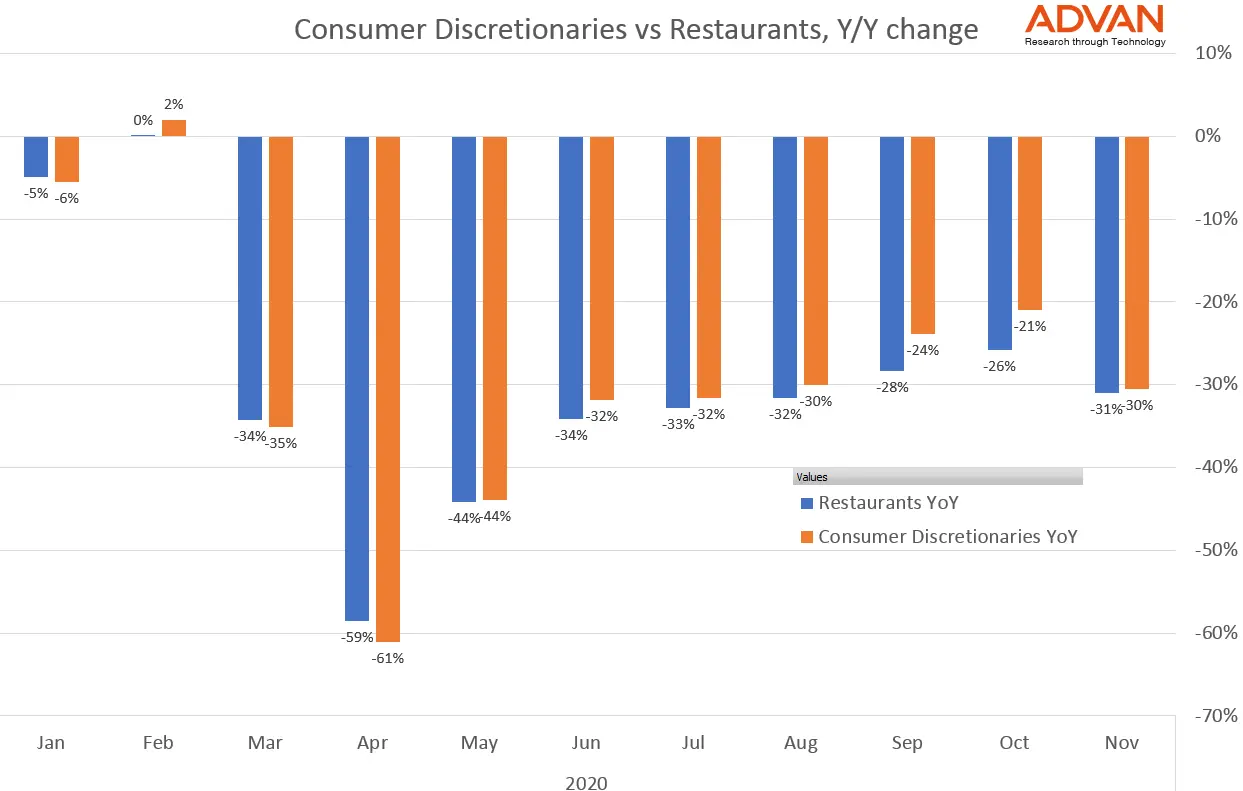
Another discretionary activity that has been highly effected by the pandemic is restaurant visitation. These have been among the most affected businesses and we see a very strong mirroring of foot traffic trends to restaurants compared to consumer discretionary retailers.
In November, restaurant visitation was down 31% year-over-year and consumer discretionary foot traffic down 30%. While this is a fairly big drop, the year over year trends have been very steady over the past several months since May, providing signs of hope that this second wave of lock-downs will not have as a dramatic impact as the first.


