
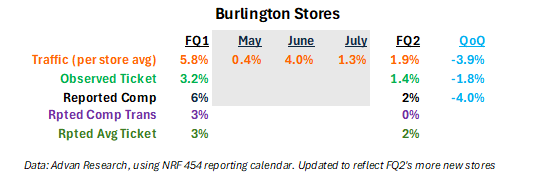
Burlington’s observed traffic (per Advan*) for FQ2 was at a slower pace than FQ1, with May impacted by the spike in gas prices. By contrast, June was surprisingly robust. July was potentially impacted by World Cup (Ross noted that). August is running slow, likely because of the later Labor Day and B2S season.
- Burlington’s average ticket (+2%) was in line with the observed figure; however, comp-transactions (flat) were less. CEO Michael O’Sullivan’s comments suggested (to our ears) that the conversion rate declined, which would explain the gap. O’Sullivan also shared that comps were below his expectations given a more subdued consumer (highlighting high gas prices and other compounding inflationary pressures). One can also see that Burlington’s high inventory levels (comp inventory +11%), i.e. they overbought the trend.
- Burlington opened more new stores than expected (+51), which accelerated its unit growth to +12.2% from FQ1’s rate (+10.3%) and the resulting impact on average per-store traffic was meaningful; we’ve updated our preview’s table with the actual figures and results (shown below).
- As was the case with TJX and ROST, Burlington plans to plow tariff refunds into lower prices in the 2H.
- Per the increase in total inventory, recall that a big portion of the ROST call was on the competitive dynamics between it, Burlington, and TJX, especially as it relates to sourcing (the focus of our note on TJX’s results -- TJX’s Marmaxx Miss – Are Burlington and Ross “stealing” the goods). Using 2024 as a cleaner comparison period, the amount of product that ROST is buying in F2026 will be +$2.2B vs. +$0.7B in 2024. We estimate that Burlington will be +$0.8B more in ’26. In total, the two will buy around +$3.0B more product from the vendors (which all three use and compete for). Marmaxx needs to buy about +$1.5B more each year; i.e. the $3.0B is meaningful.
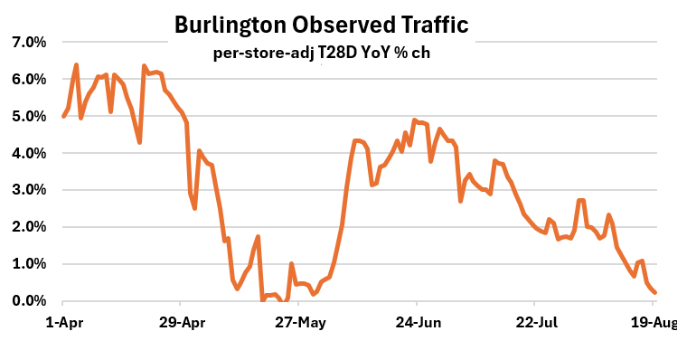

* We are aware that O’Sullivan said that May and June were stronger than July. While that doesn’t match the cadence in observed traffic, maybe they are using different period reporting (than us), or potentially conversion rate and average ticket were behind the different swings.